Investigate with Change Explorer
Prerequisites
- Product permission
changeexplorer.read, including for local case annotations, AI enrichment, exports, cleanup and Fleet batch management. These routes are not admin-only. Chat handoff separately needschat.use. - ARM access to Activity Log/change evidence across the selected scope.
- A workload or subscription whose actual resource/subscription boundaries you can verify; Tenant-wide does not enumerate every visible tenant subscription.
- Optional Graph
AuditLog.Read.Allfor directory audits and directory read access for actor names. A configured AI provider is needed for enrichment, including the automatic event-opening trigger.
Route
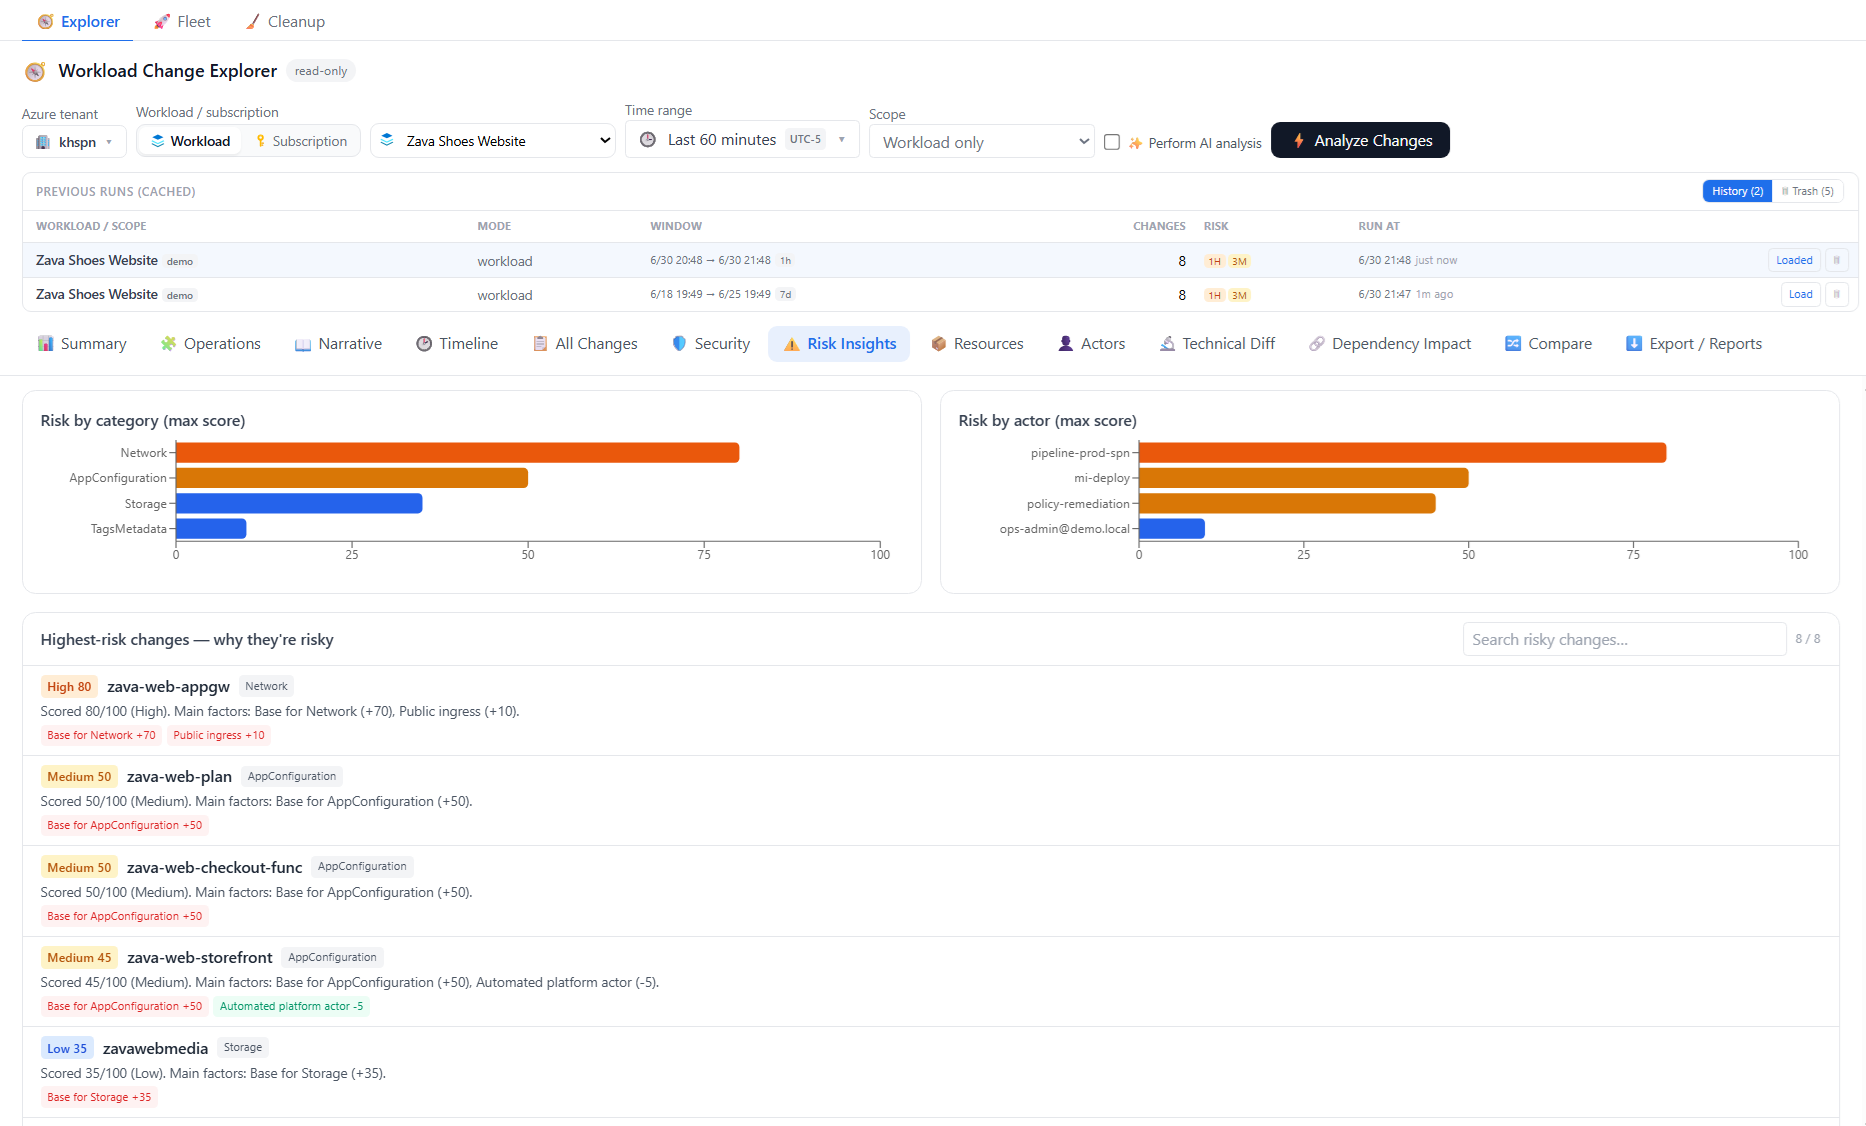
Open /change-explorer or a tab route from Summary, Operations, Narrative, Timeline, All Changes, Security, Risk Insights, Resources, Actors, Technical Diff, Dependency Impact, Compare, and Export / Reports. The surrounding modes are Explorer, Fleet, and Cleanup.
How to run a correctly scoped analysis
- Choose Explorer and select workload or subscription plus the connection.
- Set an unambiguous start/end using the time-picker recipe below. Workload selection follows the workload’s bound connection; subscription mode uses the picker connection.
- Choose Workload, Workload + dependencies, or Tenant-wide. Dependencies broadens Resource Graph to containing resource-group siblings, not graph paths. Tenant-wide uses subscriptions resolved from this workload/subscription, not all tenant subscriptions; review the actual scope despite the broader confirmation wording.
- Leave Perform AI analysis off for the initial deterministic pass, or enable it when approved. Opening an unanalyzed event later also starts AI enrichment; checkbox-off does not mean no future AI calls.
- Select Analyze Changes and monitor admission, collection, classification and optional AI phases. The run is saved before the successful completion event. A dropped single-analysis stream before that point is not guaranteed to persist; use Fleet for durable queued work.
- Confirm the displayed analyzed window and scope. If the cached-window banner differs from current selectors, re-analyze.
- If the run is marked partial, read every required-source status before interpreting an empty or short result. A throttled source is not evidence that no change occurred.
Expected result: A saved run records the requested window and collected scope, with source notes and derived views. Its annotations/enrichment can change later without recollecting the window.
Verification and safety: Check the actual subscriptions, not only the mode label. Activity Log keeps Succeeded/Accepted events from the first 25 subscriptions and may retain an explicit-ID filter in broader modes. Optional Entra audit is directory-wide, not workload-filtered. The combined run retains at most 5,000 events; some caps are not reflected in succeeded/partial status. Repeat a narrower verified window when completeness matters.
How to choose a time range without mixing local time and UTC
- Open Time range and select Presets, Relative, Date Range or Advanced.
- For an exact incident window, choose Date Range → Between, select UTC or Local, and review the conversion shown below the inputs.
- Use Since for a start-to-now window; Before covers only the 90 days preceding the chosen end. For Relative, choose a quantity/unit; for Advanced, inspect the absolute preview of tokens such as
-24handnowbefore Apply. - After applying, confirm the run’s Analyzed window rather than assuming the picker label updates an already loaded run.
Expected result: The request carries absolute ISO start/end times for the selected interval.
Verification and safety: Day/week preset boundaries are calculated in browser local time, whereas Ask’s “yesterday”/“this week” parsing is UTC-based. Compare absolute times when switching between those controls. A broad Before or relative range can exceed source limits even when the date inputs are valid.
How to use Summary, Risk Insights, and Timeline for first-pass triage
- Open Summary and record headline, window, scope, severity counts, top actor/type, and insights.
- Open Risk Insights and inspect highest-risk events before lower-severity volume.
- Open Timeline to place candidate events in chronological context.
- Open each important event rather than accepting aggregate labels as proof.
Expected result: A prioritized timeline of candidate causes and effects is established.
Verification and safety: Cite timestamps, IDs, resources, operations and underlying evidence. Risk is prioritization, not proof of impact or malice; opening a candidate event can also trigger AI enrichment.
How to inspect All Changes and deep-link exact evidence
- Open All Changes and search/filter the virtualized event grid.
- Use the plain-English question flow where available; verify the parsed time window/facets and suggested window.
- If AI use is approved, open a row’s drawer and inspect Summary and Diff & revert. Otherwise use the deterministic Technical Diff view or saved-run exports without opening an unanalyzed event.
- Open Raw only when needed; raw JSON is lazy-loaded to keep large runs responsive.
- Pin the event and save an investigator note when relevant. Copy link carries only
?change=, so record the run ID, workload/subscription and window separately. - On Timeline, All Changes or Technical Diff, use Save view to name a manual filter combination; reopen its chip to apply it or remove it with the close control. These perspectives are browser-local, not saved runs.
Expected result: The event has review notes/pins in the run’s embedded case file, and its identity can be handed to another reviewer with the saved-run context.
Verification and safety: Select/load the same saved run before opening a shared event link. The link alone does not restore the run or scope. Raw is a retained collector payload, not necessarily the original full Azure response; an empty Raw view can also mask a failed lazy read. Pins do not create a separate Case Files/Evidence Locker record or filter exports.
How to narrow Timeline without confusing a filter with a new scan
- Apply the manual/Ask filters and open Timeline.
- Drag the time-range handles or use 1h/6h/24h/7d to limit displayed events. All clears this local brush.
- If a new collection is required, choose Narrow search to this window. This starts another analysis with the selected absolute interval; it is not just a chart zoom.
- If Ask says its requested window is outside the loaded run, review the suggested absolute interval before choosing Analyze for that range.
Expected result: Local brushing narrows the timeline only; an explicit re-analysis produces a separately collected run/window.
Verification and safety: Record which operation you performed. Table filters, brush state and saved perspectives do not narrow Export / Reports, which reads the saved run.
How to interpret Operations and Narrative
- Open Operations to review groups formed by correlation ID or, when absent, actor/time bursts.
- Expand a group and compare verb, actor, resources, risk, security flags, and child events.
- Open Narrative for ordered story beats.
- Deterministic runs already build Narrative. If an older run lacks it, re-analyze; if sharper explanation is needed, use Run AI analysis. This updates the saved run without recollecting Azure.
- Validate every narrative assertion against child events.
Expected result: Related events are summarized into an investigation sequence with optional AI context.
Verification and safety: Treat time-burst grouping as heuristic and AI output as fallible. Enrichment selects at most 60 events in batches of 10; an AI-analyzed badge does not prove all events were successfully enriched. Preserve exports if the prior deterministic interpretation must be retained.
How to investigate Security signals
- Open Security and filter/search flagged events.
- Review public exposure, grants, secret access/change, disabled logging, removed locks, exemptions, off-hours, first-time actors, mass deletion, and escalation signals.
- Open the underlying event and technical diff.
- Correlate with approved change records, identity/RBAC evidence, and organizational working hours.
- Pin substantiated events and note disposition.
Expected result: Security flags become validated leads or documented false positives.
Verification and safety: Confirm resource, actor, operation, timestamp, before/after and business context. Flags are not verdicts, and an empty Security result is only meaningful after checking source completeness and caps.
How to investigate Resources and Dependency Impact
- Open Resources and select a changed resource.
- Review its event history across the analyzed window.
- Open Dependency Impact to read role groups and inferred blast-radius text based on resource type/name.
- Independently validate dependencies against architecture, runtime telemetry and service ownership; this view contains no measured direct/transitive graph edges.
Expected result: Resource-local event history and generic role-based impact hints guide questions for further investigation.
Verification and safety: Do not report an outage or propagation path from the role label alone. Workload + dependencies adds resource-group siblings to Resource Graph scope; it does not prove those siblings depend on the changed resource.
How to resolve actors without mislabeling unknown identities
- Open Actors and inspect display name, stable ID, actor kind, source IP, on-behalf-of context, and activity count where available.
- Distinguish User, Service Principal, Managed Identity, Azure Policy/platform/system, and Unknown badges.
- Treat an unresolved GUID as an identity-resolution limitation, not anonymous activity.
- Check Connection Capability and Graph consent when names remain unresolved.
- Correlate actor events with approved change records and source IP context.
Expected result: Activity is attributed as precisely as available evidence permits, with graceful degradation.
Verification and safety: Compare object/app IDs and claims with Graph/Activity Log. Names are cached for 12 hours; missing/deleted/cross-tenant identities may remain unresolved. Graph 401/403 can indicate access problems, but a 400 does not justify granting more directory permissions. Actor attribution may use a unique same-resource event within five minutes when correlation is absent, so it remains a lead to verify.
How to inspect Technical Diff and rollback hints safely
- Open Technical Diff or an event drawer’s Diff section.
- Compare available before/after properties and security-sensitive fields.
- Review any rollback hint as read-only guidance only.
- Confirm the current Azure state and use the owning service’s approved change process for remediation.
Expected result: Property-level evidence supports a remediation plan without Change Explorer mutating Azure.
Verification and safety: Missing before-data means evidence was unavailable, not that no change occurred. Resource Graph detail is capped at 40 properties per row and long strings at 1,500 characters. Use Show more beyond the first 50 diff events; inspect current Azure state before executing any copied hint externally.
How to compare two runs
- Open Compare; the most recent other run can be selected as a baseline automatically.
- Choose runs with comparable scopes and windows.
- Review Added/Removed as membership in the two event sets, not resource creation/deletion. Changed in both means events occurred in both runs; compare risk and event-count deltas.
- Open underlying events in each run when a delta matters.
Expected result: The later run is contrasted with a meaningful baseline.
Verification and safety: Confirm run IDs, scope, source completeness, AI state and baseline direction. The API does not reject incomparable scopes/windows; that review is the investigator’s responsibility.
How to operate Fleet and background analysis
- Choose Fleet to see the latest run per active workload, with never-analyzed workloads last and higher risk prioritized.
- Review run age, scope mode, total changes, and severity counts.
- Select workloads, choose one time window, Workload/Workload + deps and Fast/AI, then use Analyze selected. Selection snapshots that configuration into the batch; later control changes do not rewrite queued work.
- Navigate away or reload if needed. Return to Fleet to reattach to the latest database-backed batch; interruption recovery requeues expired leased work.
- Use Cancel pending to stop queued items, not to roll back already running/completed analysis. After the batch settles, use Retry failed for failed/partial/cancelled items; it creates a new batch with the original configuration.
Fleet uses the durable server queue, unlike a single Explorer stream. Normal PostgreSQL-backed admission allows two analyses globally and one per tenant/Azure-principal lane; local/distributed-failure fallback is process-local. Direct analyses and Mission Control share the analysis gate, so waiting under load is expected. Retryable Fleet failures/partial outcomes get up to three item attempts by default, separate from Azure source retries.
Expected result: Fleet identifies stale, never-analyzed, or high-risk workloads from saved runs.
Verification and safety: Inspect terminal batch/item counts and the source diagnostics of each run; a Fleet row can still show an older saved result while another attempt runs. Successful items are not blindly replayed by Retry failed. Fleet’s latest result is not a substitute for checking the exact window/scope and is not a recurring schedule.
How to build investigation evidence and export the right format
- Pin relevant changes and save per-change notes. The current UI does not expose the case-summary editor; that field is supported by the run’s case API. Use Investigate only when an approved Chat/Deep Investigation handoff is needed.
- Open Export / Reports and choose the minimum necessary artifact:
- CSV for event filtering.
- High-risk CSV for critical/high events.
- JSON for the full run and raw operational payloads.
- Executive Markdown for a concise briefing.
- Technical Markdown for engineering handoff.
- RCA Markdown as a reviewed starting template.
- ServiceNow text for ticket transfer.
- Validation queries as ARG/CLI/PowerShell/KQL starting points (the ARG example includes only the first 50 event resource IDs).
- PDF for a board-oriented report containing the first 20 operations and top 25 events, not the full evidence set or every per-event note.
- Open the download and verify scope, window, event count, and redaction/handling requirements.
- Store and share according to evidence policy.
Expected result: A fixed investigation artifact is downloaded from the saved run.
Verification and safety: Exports use the stored run, ignoring table filters, the timeline brush and pinned selection. JSON retains case notes and source payloads; high-risk/executive formats are not redaction. Compare metadata/sample events, review sensitive content and retain a copy before history limits remove the run. ServiceNow text is a manual handoff, not ticket delivery. Never treat generated RCA as an approved conclusion.
How to trash, restore, or purge runs
- Open run history or Cleanup.
- In Cleanup, review quick selections such as Older than 30/90 days, Retain last N per scope, Demo, or Empty / failed. Presets act across stored active scopes, not just the current scope-search results. The Empty / failed preset selects zero-change runs, which can be legitimate successful analyses.
- Trash obsolete runs; the payload remains stored and is recoverable.
- Restore a mistakenly trashed run.
- Purge only after confirming incident, legal, audit, and retention requirements; bulk cleanup supports selected run IDs and can purge active as well as trashed runs.
Expected result: Trashed runs remain restorable; purged runs are permanently deleted.
Verification and safety: Confirm the restored run reappears or the purged run is absent. Preserve required exports before purge and before the 30-active-run-per-scope save limit removes older runs automatically. Trash does not reclaim the underlying payload despite size/free-space wording; purge is permanent.
Safety and rollback
- Change Explorer is read-only with respect to Azure and never performs rollback.
- AI enrichment and risk/security classification can be wrong.
- Actor resolution and technical diff are best-effort.
- JSON/raw exports can contain sensitive operational identifiers and payloads.
- Single Explorer streams are not durable Fleet jobs; interrupted analysis may need a new run. AI can start when an event opens even with Perform AI analysis unchecked.
- Perform remediation through a separate approved service/IaC workflow, then run a new Change Explorer analysis for verification.
Troubleshooting
| Symptom | Cause | Resolution |
|---|---|---|
| No events / Tenant-wide misses a subscription | Scope is derived from selected workload/subscription, and feeds have separate caps/filters. | Verify resolved subscriptions and source diagnostics; run a narrow analysis of the missing subscription. |
| Cached-window banner | Auto-loaded history differs from current selectors. | Load the intended run or re-analyze current selectors; do not relabel old evidence. |
| Actor unresolved | Graph access, cached misses, deleted or cross-tenant objects. | Check the actual error, consent and lookup age; unresolved does not mean anonymous. |
| Narrative empty | Older run lacks derived story data. | Re-analyze; deterministic runs can produce narrative without AI. |
| AI starts unexpectedly | Opening an unanalyzed event triggers enrichment. | Avoid that interaction until provider use is approved; use deterministic diff or exports without the drawer trigger. |
| Raw/diff incomplete | Source data is projected/capped, missing, or a lazy fetch failed. | Verify against source logs and current state; an empty object is not proof of no change. |
| Partial/throttled run | A required source failed, or collection reached a reported cap. | Inspect source notes/retryability, fix access or wait, then narrow and rerun; check Fleet’s item results separately. |
| Hourly limit / token budget error | App-level expensive-operation controls rejected the stream. | Respect the retry interval and request a usage/budget review instead of repeatedly launching. |
| Export ignores filters | Reports read the stored run. | Use high-risk output or a newly scoped run, then review/redact the download before sharing. |
| Shared link opens nothing | It has only the event ID, not the saved run context. | Select/load the recorded run first. |
| Run disappeared | Active-run retention, trash or purge removed it from history. | Check Trash and retained exports; history is not indefinite evidence storage. |