Change Explorer
Product permission: changeexplorer.read. It gates all Change Explorer endpoints, including analysis, AI enrichment, reports, case notes, trash/restore/purge and Fleet batch management; these are not admin-only operations. Administrators pass the guard. The permission is Azure-read-only, not read-only access to stored investigation records. Chat handoff separately requires chat.use.
Purpose
App routes: /change-explorer and /change-explorer/:tab Change Explorer collects a bounded Azure change window, classifies activity, resolves actors where possible, and saves a forensic run. Perform AI analysis is off by default in the UI, but opening a change record also starts enrichment for a nonempty, non-demo run that has not been AI-analyzed. Leaving the checkbox off is not a guarantee that subsequent interaction makes no AI call.
Prerequisites and data sources
- An ARM-capable connection with access to Activity Log/change evidence across the selected scope.
- A registered workload or selected subscription. Workload analyses use the workload’s bound connection; subscription analyses use the selected/default connection. See scope behavior below before choosing the broadly labeled Tenant-wide mode.
- Optional Microsoft Graph
AuditLog.Read.Allfor directory audits and appropriate directory read access (the resolution guidance namesDirectory.Read.All) for actor names. An ARM token alone does not grant Graph access. - A configured AI provider only for optional narrative/enrichment; deterministic analysis does not require AI.
- On the service-principal Activity Log path, enabled command execution and an available/allowed Azure CLI; non-service-principal connections normally use ARM REST instead.
Tabs and actions
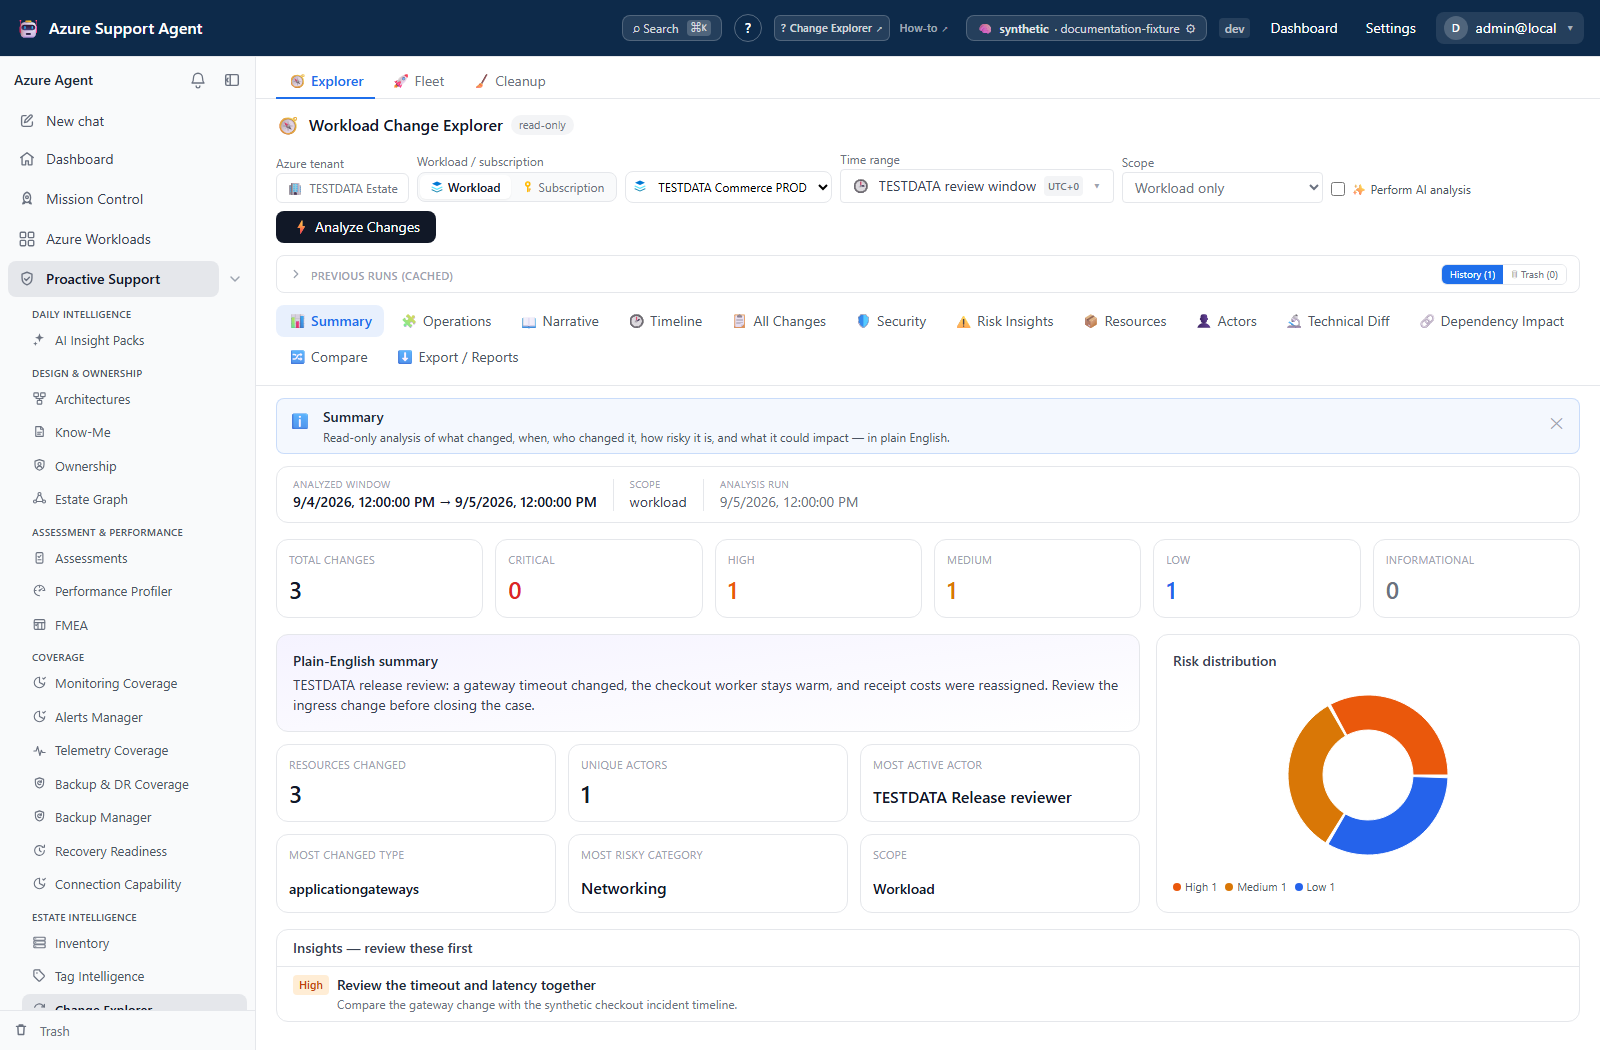
- Summary: headline, analyzed window, scope, severity counts, top actor/type, and insights.
- Operations: correlated operations or actor/time bursts with verb, resources, highest risk, and flags.
- Narrative: deterministic chronological story beats built from operations; optional AI enrichment sharpens event text/risk and rebuilds the derived views. Empty narrative can also indicate an older saved run.
- Timeline: chronological interactive event view.
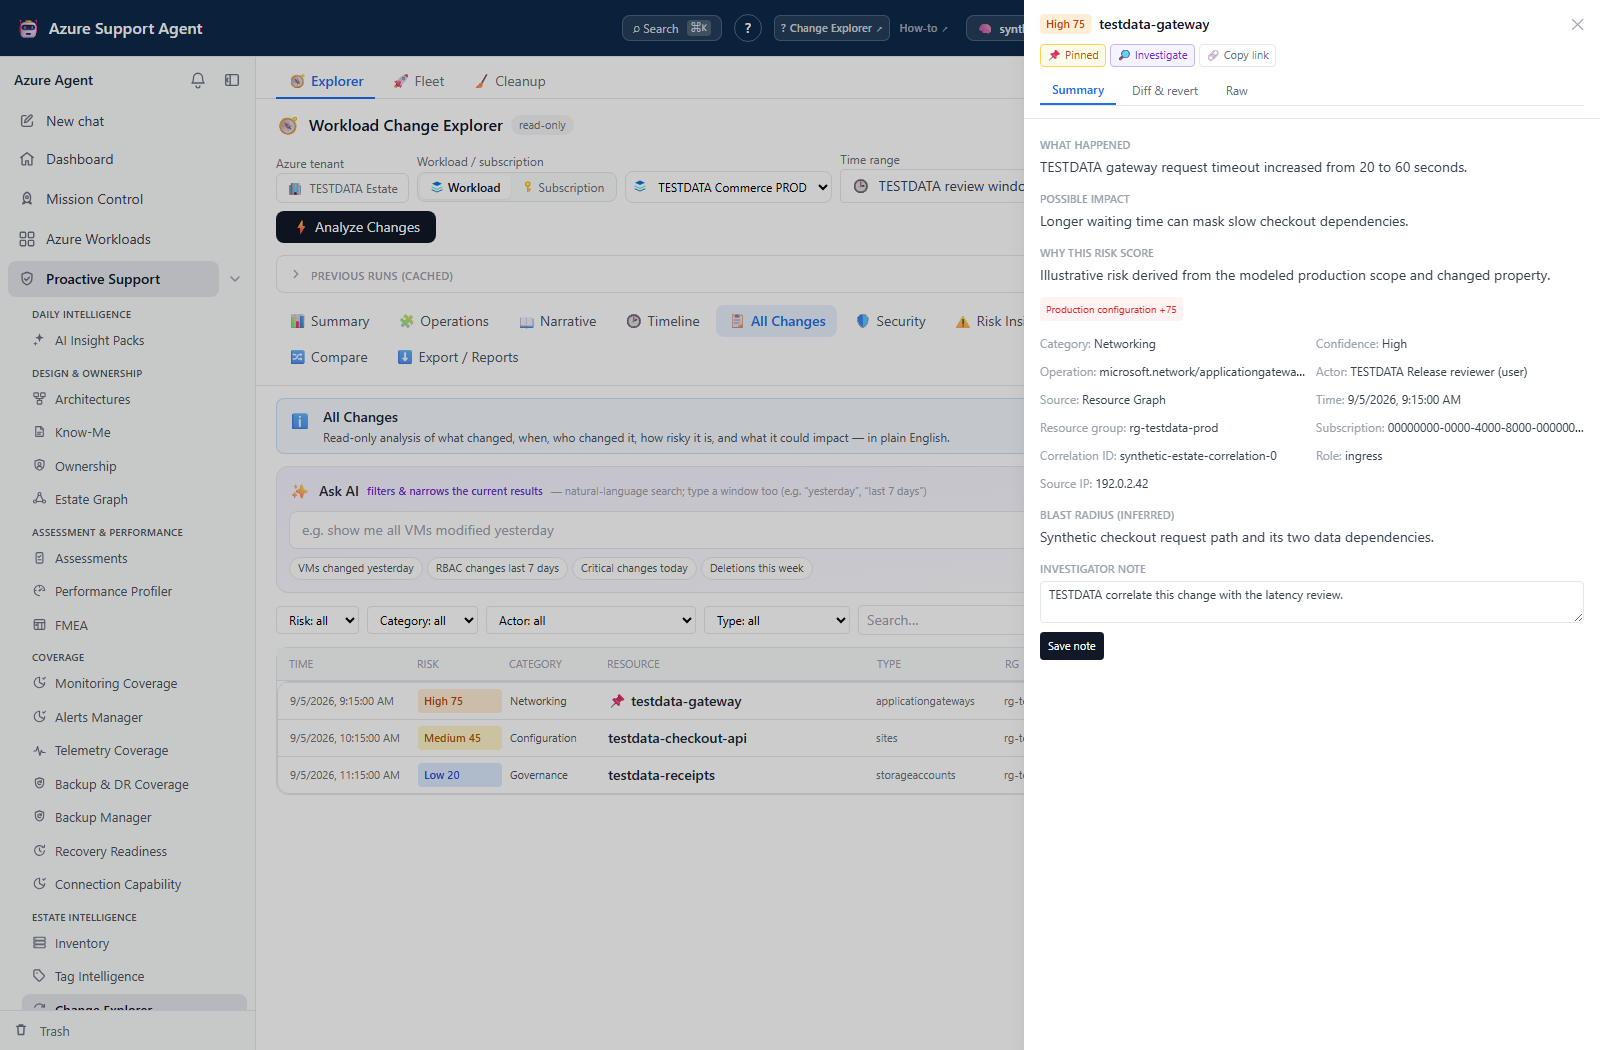
- All Changes: virtualized searchable event grid and detail drawer.
- Security: flagged events and suspicious patterns such as public exposure, grants, secret access/change, disabled logging, removed locks, exemptions, off-hours activity, mass deletion, or potential escalation.
- Risk Insights: severity distribution and highest-risk events.
- Resources: per-resource history and available blast-radius context.
- Actors: resolved identity kind, source information where available, and activity counts.
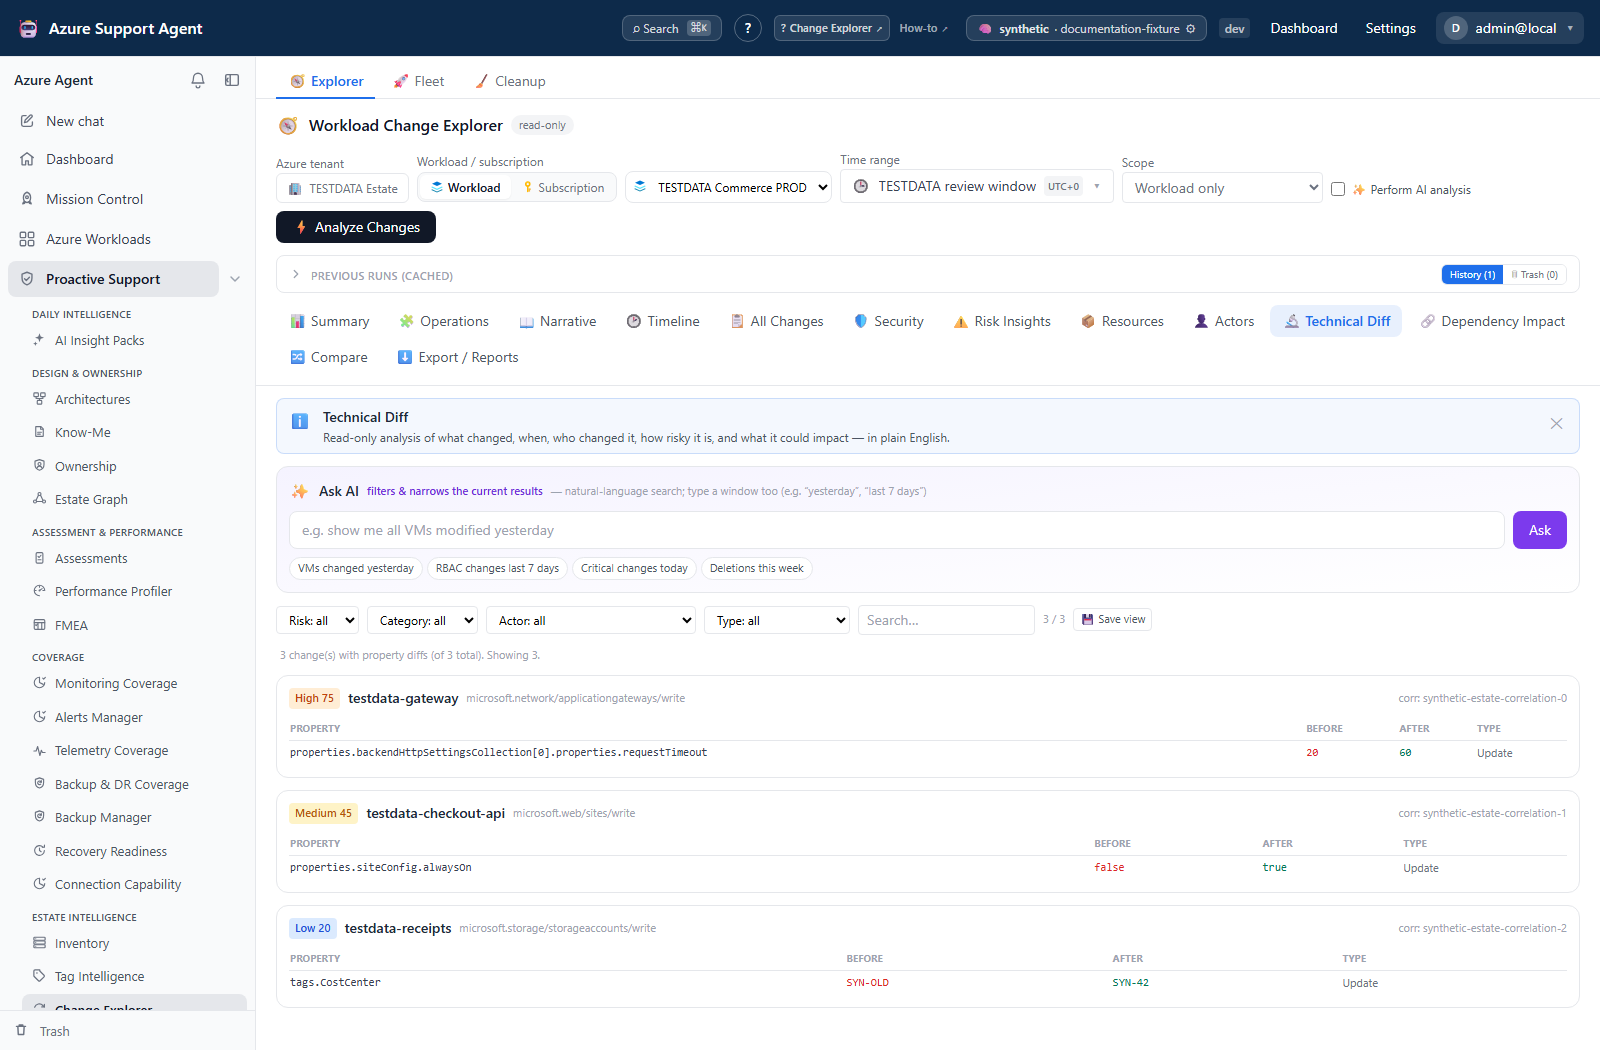
- Technical Diff: before/after property differences for available events.
- Dependency Impact: groups events by roles inferred from resource type/name and shows generic possible-impact text. It is not a measured dependency graph or a direct/transitive path analysis.
- Compare: deltas between two saved runs.
- Export / Reports: CSV, high-risk CSV, JSON, executive/technical Markdown, RCA, ServiceNow text, validation queries, and PDF.
The surrounding Fleet view ranks workloads by latest run/risk. Cleanup supports trash, restore, and permanent purge.
Freshness and scope behavior
Each run records its start/end window; changing selectors does not recollect it. AI enrichment and case annotations can update the saved record. Run history is server-side JSON, bounded to 30 active runs per workload/subscription key when new runs are saved; older active runs are removed, not moved to Trash. Trashed runs are excluded from that active-run cap and remain recoverable until purged. The compact Explorer history displays only 12 entries at a time; Cleanup covers the stored cross-scope history. Export required evidence before it ages out.
Raw JSON is omitted from lightweight reads and fetched on demand. It is the payload retained by the collector, not a promise of the untouched full Azure response: Resource Graph raw data omits the original changes map, and CLI Activity Log data is projected to selected fields.
Activity Log and Resource Graph are eventually consistent. A run performed immediately after a change may need to be repeated later. Actor resolution is best-effort and can degrade without Graph permissions.
Direct analysis, Fleet and Mission Control share admission of at most two analyses and one per tenant/Azure-principal lane. PostgreSQL-backed admission coordinates replicas; local operation or a distributed-admission failure falls back to process-local limits. A direct request may reuse a recent successful run matching its scope/window while waiting; this is bounded reuse, not indefinite caching of an analysis request.
Fleet uses database-backed work batches, with progress, retry and interruption recovery independent of the browser. Explorer’s single analysis uses a browser module-level stream registry: it survives in-app navigation, but is not the same durable queue. The API saves only at successful completion before emitting done; a disconnect or restart before then is not guaranteed to leave a saved run.
Collection and display limits
| Boundary | Meaning for a reviewer |
|---|---|
| Resource Graph change feed | Default 5,000 rows; configurable from 100 to 50,000, paged rather than limited to one 1,000-row response. It joins against current resources, so deleted resources can be absent; use Activity Log evidence too. |
| Activity Log | First 25 resolved subscriptions, up to the configured change limit per subscription, and only Succeeded/Accepted operations. Failed attempts are not included. The subscription and row caps do not always produce a completeness warning. |
| Combined run | At most 5,000 events retained after combining sources, before final chronological sorting. This is not necessarily the newest 5,000 events across all sources; increasing the source limit does not raise this cap. |
| Technical diff | Up to 40 property entries per Resource Graph row; string values can be cut at 1,500 characters. The Technical Diff UI initially renders 50 events and offers Show more. |
| Entra audit | Optional directory-wide events in the time window, not filtered to the selected workload; up to 4,000 raw audit records are read before category/output filtering. |
| AI enrichment | At most 60 selected events, in batches of 10; unknown categories are prioritized, then higher-risk known events. An AI-analyzed run does not mean every event received successful AI enrichment. |
Source diagnostics distinguish required Resource Graph/Activity Log failures from optional Graph evidence. Check analysisOutcome, sourceProvenance, retryable, truncated and changeLimit; the lightweight /changeexplorer/runs/{run_id}/diagnostics endpoint exposes source status without event payloads. A succeeded status is not a completeness guarantee for limits that are not surfaced. Narrow the selection and reconcile source counts before treating an empty result as no activity.
Workflow overview
Configure an analysis
Choose workload, connection, start/end time, and scope mode:
- Workload builds a Resource Graph predicate from the workload’s subscription, management-group, resource-group and explicit-resource nodes.
- Workload + dependencies broadens explicit resource IDs to their containing resource groups (sibling candidates); it does not traverse a dependency graph.
- Tenant-wide broadens the Resource Graph predicate to subscriptions already resolved from the workload/selected subscription, not every subscription visible to the connection. The confirmation wording is broader than the current implementation.
The Activity Log collector applies its own explicit-resource ID/prefix filter when that list is present, even in broader modes. Without explicit IDs it reads the resolved subscriptions. Entra audit remains directory-wide. Therefore, do not assume every source has identical resource boundaries or that workload exclusions are reapplied to every feed.
The time picker has Presets, Relative, Date Range (Between/Since/Before), and Advanced relative tokens. Date Range supports Local/UTC entry; requests use absolute ISO times. Preset day/week boundaries are calculated in browser local time, whereas Ask’s “yesterday” and similar phrases are parsed in UTC. Before uses a bounded 90-day window, not all earlier history.
Enable AI only when contextual narrative/risk enrichment is valuable and approved. API clients must send run_ai=false for an initial deterministic analysis: the API default is true, unlike the UI’s unchecked default. Start the streaming analysis and monitor collection, classification, and AI phases. The run is persisted before completion is returned.
Investigate a run
- Confirm the displayed analyzed window and scope. A stale-window banner means the saved run does not match current selectors; re-analyze instead of assuming it does.
- Start with Summary and Risk Insights, then validate high-risk events in All Changes.
- Open an event drawer, recognizing that this can invoke AI enrichment. Inspect Summary and Diff & revert; Raw is loaded only on demand. Copy-only rollback hints are not executed by this screen.
- Use Security flags as leads, not verdicts. Confirm context and expected change records.
- Review Actors. An unresolved identifier means Graph resolution was unavailable, not that the actor was anonymous.
- Inspect resource history and dependency impact before declaring blast radius.
- Pin relevant events and save investigator notes into the run’s embedded case file, or hand off to Chat/Deep Investigation. This does not itself create a separate Case Files or Evidence Locker record. The API supports a case summary, but the current Explorer UI has no case-summary editor.
- Compare against a suitable prior run and export the minimum evidence needed.
Interpretation of results
- Risk is triage prioritization, not proof of impact or malicious intent.
- Operations can be grouped by correlation ID or actor/time burst; grouped events are related heuristically when correlation is absent.
- Security patterns such as off-hours or first-time actor require organizational context.
- Technical diff availability depends on source evidence; absence of a before value is not proof that nothing changed.
- Dependency roles and impact text are type/name heuristics, not verified runtime edges or an observed outage.
- AI narrative and re-scoring can be wrong. Cite underlying events and timestamps in an incident conclusion.
- A run marked partial did not complete one or more required sources. The banner identifies failed/incomplete sources and row counts; the diagnostics response carries retryability. Optional Entra/identity failures and some caps may not make the run partial.
- Compare’s Added/Removed resources mean present in one run’s event set but not the other. They do not prove resource creation/deletion; “Changed in both” means events occurred in both windows.
Exports, history, scheduling, and integrations
Exports read the saved run, not the current table filters, timeline brush, or pinned subset. CSV includes all retained events; high-risk CSV selects Critical/High. JSON includes retained raw payloads and case notes. Executive/technical/RCA Markdown and ServiceNow text are generated documents; ServiceNow text is not automatic ticket delivery. PDF includes the first 20 operations and top 25 events by risk, with case-summary/pin information, not every investigator note. Validation queries are copy-only ARG/CLI/PowerShell/KQL starting points; the ARG example includes only the first 50 event resource IDs.
Save view stores named manual filter combinations in the browser. It does not save the run, time window, AI query or an estate-wide server view. Copy link carries ?change= only, not a run ID or complete scope: separately identify/load the same saved run before expecting the event to reopen. Fleet’s launch is an on-demand batch, not a recurring schedule control.
Safety and limitations
- Change Explorer never reverts Azure changes, even when the drawer says Diff & revert. Copied hints can become writes if executed elsewhere; review current state and use the owning service’s approved change process.
- AI enrichments can modify saved narrative and risk. Review provider/data-sharing policy before opening an unanalyzed event, not just before checking Perform AI analysis.
- Exports and raw payloads contain operational identifiers. High-risk or executive output is not automatic redaction, and visible filters do not constrain downloads.
- Trash preserves the stored payload; only purge removes it. Cleanup’s size display is an estimate, and its Empty / failed preset selects zero-change runs, which can include legitimate complete analyses. Review every selected run. Purge can remove active as well as trashed records and cannot be undone.
- Preserve required evidence outside the bounded run history. Do not mistake generated RCA text, risk labels, inferred actors or blast-radius hints for an approved incident conclusion.
Troubleshooting
| Symptom | Cause | Resolution |
|---|---|---|
| No events or a short result | Wrong window/scope, unavailable feeds, filtering or unsurfaced caps can resemble inactivity. | Check source diagnostics and actual subscriptions, clear result filters, then rerun a narrower verified window. |
| Cached-window banner | The auto-loaded run differs from the selectors by scope or more than the 90-second time tolerance. | Load the intended historical run or re-analyze current selectors; do not relabel old evidence. |
| AI starts with the checkbox off | Opening an unanalyzed event also triggers enrichment. | Avoid that interaction until provider use is approved; deterministic Technical Diff and saved-run exports do not use that drawer trigger. |
| Narrative/Operations is empty | Older runs can lack derived views; these views are not inherently AI-only. | Re-analyze the same bounded window and check collection notes. |
| Actor remains an ID | Graph access, deleted/cross-tenant objects, or a cached lookup may explain it. | Check the actual Graph error and consent; do not grant directory permissions for a malformed-request error. Names are cached for 12 hours. |
| Partial/throttled run | A required source failed or was capped. | Read source notes, correct access or wait for throttling to clear, narrow the window, and retry. Fleet retries retryable partial items up to its item attempt limit (three by default). |
| Hourly expensive-operation limit / token budget reached | Application admission limits, not necessarily Azure throttling, rejected the stream. | Respect the retry interval and ask an administrator to review usage/budgets rather than repeatedly launching scans. |
| Copy link opens no event | The URL does not identify its saved run. | Select the same workload/subscription and load the recorded run, then reopen the link. |
| Export includes hidden events | Export uses the saved run, not UI filters. | Use high-risk output or create an appropriately scoped new run; inspect and redact the downloaded artifact before sharing. |
| Old run is missing | The 30-active-run cap may have removed it, or it was trashed/purged. | Check Trash and preserved exports; do not assume all prior runs remain indefinitely. |
Screenshot walkthrough
These synthetic browser fixtures illustrate a saved-run investigation. They do not verify live Azure changes, actor attribution, impact, or successful collection.
1. Check the saved review window
2. Inspect the event behind a risk label
3. Compare available property evidence