Estate Graph
Purpose
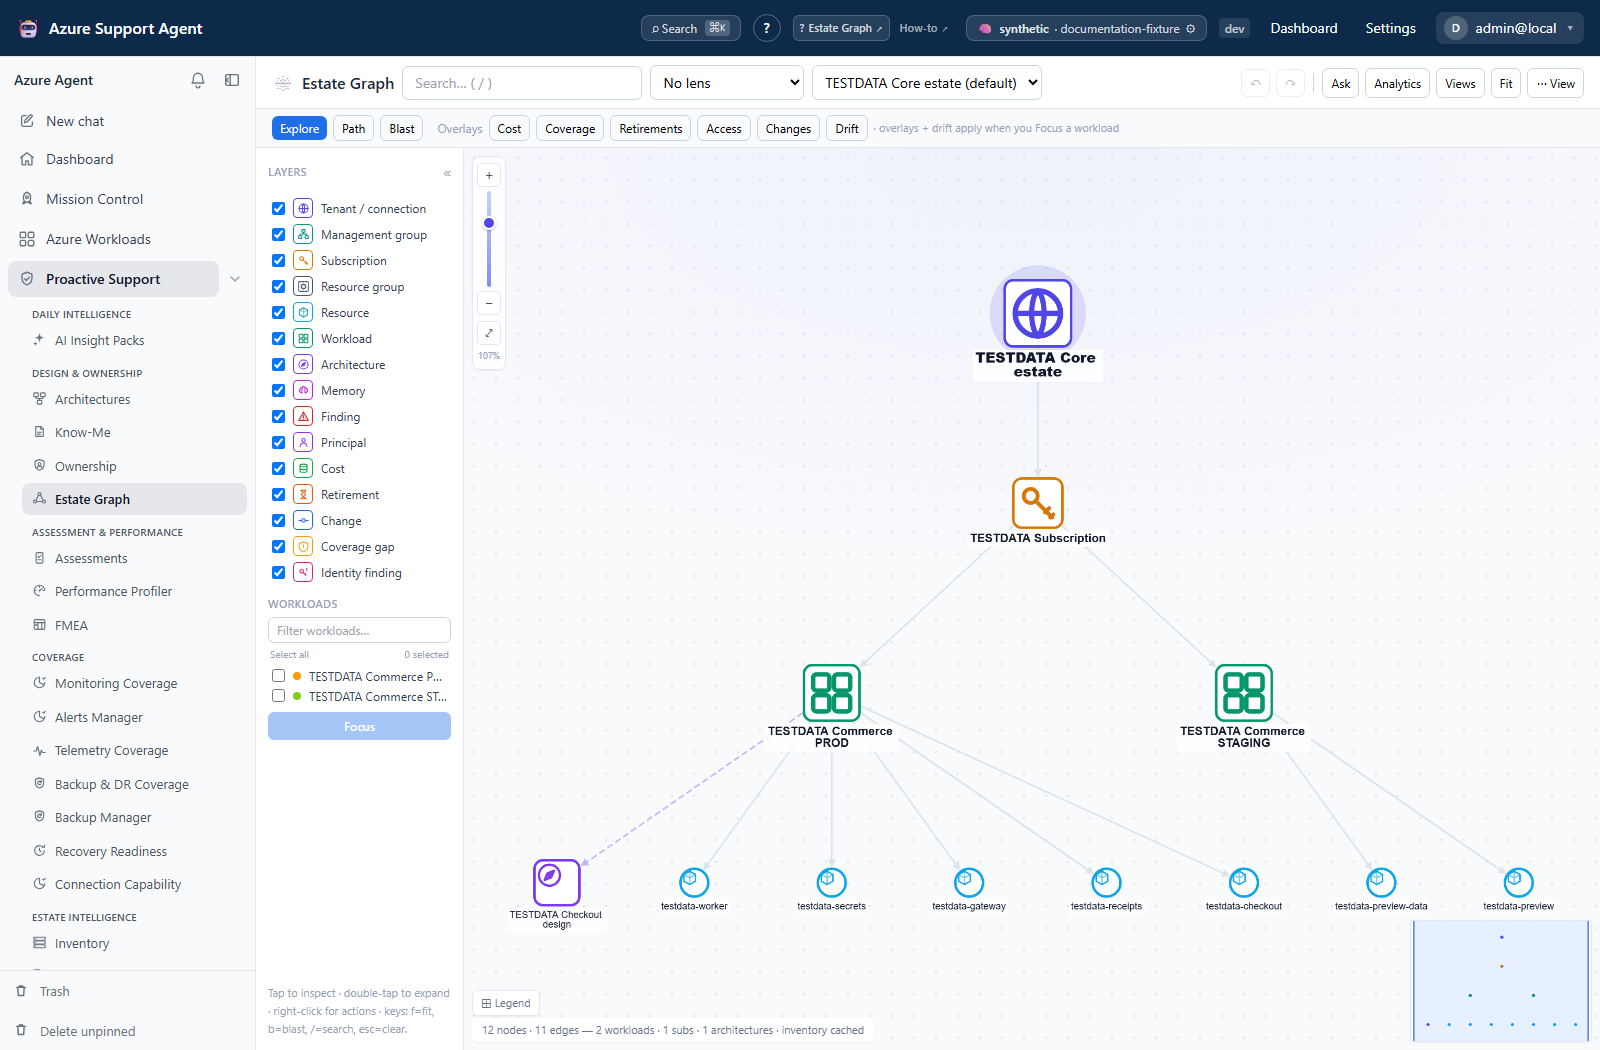
Estate Graph combines workloads, architectures, cached inventory, findings, and operational overlays into an interactive relationship map. Use it to navigate dependencies, inspect a node, compare paths, and estimate blast radius without starting a live estate-wide Azure scan.
Application routes: /graph and /graph/:focusId.
Common use cases
- Find a workload, resource, subscription, or architecture and inspect its context.
- Visualize multiple workloads and shared dependencies.
- Find a shortest relationship path between two nodes.
- Estimate direct and indirect blast radius from a selected node.
- Overlay cost, coverage, retirement, access, and change signals.
- Save a useful filtered view for repeated investigations.
Prerequisites, permissions, and data
graph.readgates graph endpoints, including AI questions, saved-view writes/deletes, and layout preferences. Built-in operator and auditor roles include it; it is not intrinsically admin-only or a no-local-write grant. Owner decoration also calls the ownership resolver withownership.read.- Workload definitions, architecture records, and cached inventory populate core nodes and edges.
- Findings and overlays depend on available assessment, cost, monitoring coverage, Retirement Radar, RBAC, and Change Explorer data.
- Select the correct Azure connection before interpreting tenant-specific scope.
- Because graph assembly is cache-oriented, refresh the source feature rather than expecting the graph to perform a live scan.
Controls and actions
Explore mode
Search for nodes, select one to inspect, double-select to expand where supported, or use the context menu to focus and show related data. The left controls select workloads and node kinds. Pan, zoom, fit, hide/show node kinds, and switch layout or visual lens as needed.
Path mode
Choose a source and target. The UI requests an undirected shortest path through the currently loaded graph model. Hiding a layer changes its display, not the model sent to the path API; a result can include hidden nodes. No path means no relationship was found in that supplied model, not that no real-world dependency exists.
Blast mode
Choose a source node to highlight direct and indirect connected nodes. The UI requests an undirected, three-hop analysis (the API clamps depth to 1–6). It is not exclusively downstream impact and does not establish that every returned workload would fail. Hiding layers does not remove those nodes from the analysis.
Focus, overlays, and drift
Focus a workload before applying overlays or drift. Available overlays are:
- Cost — cached cost context;
- Coverage — monitoring or related coverage gaps;
- Retirements — relevant retirement records;
- Access — RBAC/access context;
- Changes — recent cached Change Explorer records.
Drift compares intended architecture membership with cached inventory, not a fresh Azure scan. The API’s compare operation compares two workload/subscription scopes, not two historical snapshots; it is not a separate visible Compare tab here. An empty overlay may mean no findings, no supported data, or stale/missing cache. Graph permission gates these aggregate reads; opening a contributing module uses that module’s own permission.
Additional tools
Use the node inspector’s Open in links for underlying records. Estate analytics computes concentration risk, communities, hygiene, and candidate workloads over the full cached estate, not just the visible canvas. Ask the graph also searches the full cached model; narrative uses an estate summary and adds drift for a focused workload. Neither inherits all visual filters. Saved views preserve focus, lens, layout, hidden kinds, and overlays; undo/redo covers local structural view changes. Keyboard shortcuts include fit, blast, search, and clear.
Workflow
- Select the correct Azure connection and load the overview.
- Search for a workload and focus it.
- Expand relevant dependencies and inspect node details.
- Enable one overlay at a time and note its source freshness.
- Use Path to test a dependency question or Blast to estimate reach.
- Compare the graph with the reviewed architecture and source-module records.
- Save the view or export a snapshot for discussion.
Interpret results
Node and edge presence means that the relationship was assembled from application records or cached evidence. It does not establish live traffic, current health, or causality. Centrality and blast-radius counts indicate graph structure, not business criticality. AI narrative summarizes the supplied graph and may miss hidden or uncached dependencies.
Exports, history, and integrations
- Export the current visible graph as high-resolution PNG.
- Export current model nodes and edges as JSON for analysis or evidence handling. Unlike PNG, JSON includes loaded hidden-layer nodes; hiding is not redaction.
- Save named views and delete obsolete ones.
- Local undo/redo covers visual structural changes during the session; source history remains in the contributing modules.
- The graph integrates with Architectures, Ownership, Assessments, cached inventory, coverage, retirement, RBAC, cost, and changes.
Safety and limitations
- Estate Graph is primarily cache-backed and can be stale or incomplete.
- Workload focus, expansion, and collapse change the supplied model. Layer hiding alone does not exclude nodes from path, blast, or JSON export; estate analytics is separately computed over the full cached graph.
- The blast-radius tool does not model redundancy, failover, traffic routing, or application behavior.
- AI narrative is advisory and should be checked against node details and source modules.
- Exported images and JSON can reveal topology and resource identifiers; store them securely.
- Saved views preserve presentation choices, not a frozen evidence snapshot.
Troubleshooting
| Symptom | Checks |
|---|---|
| Overview is empty | Confirm graph.read, connection, workload registry, and inventory cache. |
| Overlay has no nodes | Refresh its source module, verify permission and focus scope, and check source freshness. |
| Search misses a resource | Confirm it is inside cached inventory and the selected connection; try workload or resource name. |
| No path is found | Expand relevant nodes, unhide node kinds, and verify the relationship exists in architecture/inventory. |
| Graph is crowded | Focus fewer workloads, hide irrelevant kinds, collapse findings, or change layout. |
| JSON contains hidden resources | JSON exports the loaded model, not only visible layers. Review the artifact before sharing; use a smaller focused model rather than hiding sensitive nodes. |