Performance Profiler
Application route: /performance
Product permission: perfprofile.read
Purpose
Performance Profiler reads Azure Monitor metrics for a workload or subscription, evaluates the observations against AMBA-aligned metric definitions, and ranks possible bottlenecks. It is a read-only Azure analysis surface: a high-ranked metric identifies where to investigate, not the root cause by itself.
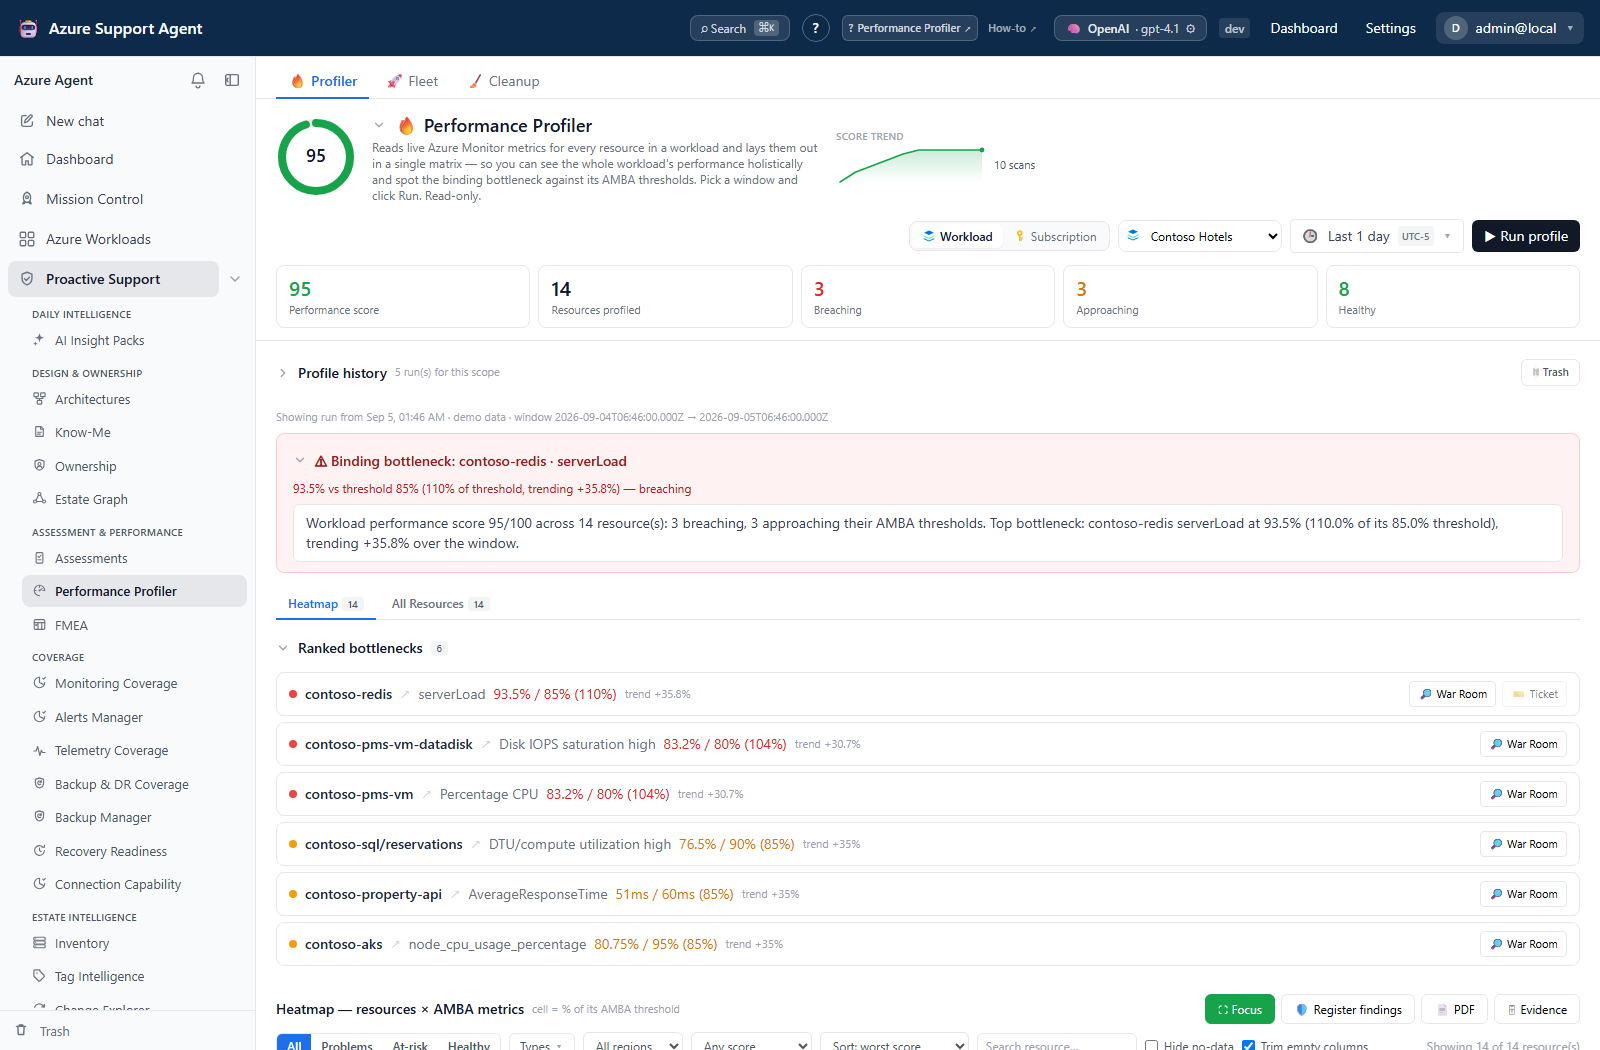
Screenshot context: These native application views use isolated synthetic demo data, not live Azure evidence or measured production performance. Demo Azure writes are disabled. Scores and headroom are decision-support outputs, not a capacity guarantee; missing observations remain unknown rather than healthy.
Prerequisites and data sources
- The user needs
perfprofile.readfor every profiler, Fleet, history, cleanup, report, evidence, finding, and ticket endpoint. - The selected Azure connection must be enabled and able to read Resource Graph and Azure Monitor metrics for the scope.
- Workload profiling uses the workload’s connection unless an explicit connection is selected. Subscription profiling uses the selected subscription and connection.
- Resource discovery comes from Azure Resource Graph. Metric observations come from Azure Monitor. Metric definitions, thresholds, severity, aggregation, and direction come from the active AMBA reference.
- A configured AI provider is optional and supplies the narrative only. Scores and collection status do not depend on AI.
- Jira or ServiceNow is required only for the Ticket handoff. Evidence and Performance findings are application artifacts.
Tabs and actions
Profiler
Choose a workload or subscription, connection, and exact time range, then select Run profile. The screen streams per-resource progress and keeps the stream active while navigating within the same browser tab.
If the stream fails or closes before a terminal event, the UI reports the interruption, clears its local running indicator, and refreshes Profile history and Fleet. A disconnected stream is not proof that collection failed: the server-side task may still finish and save its attempt. Reopen history and check the scope, time window, and saved status before submitting another run.
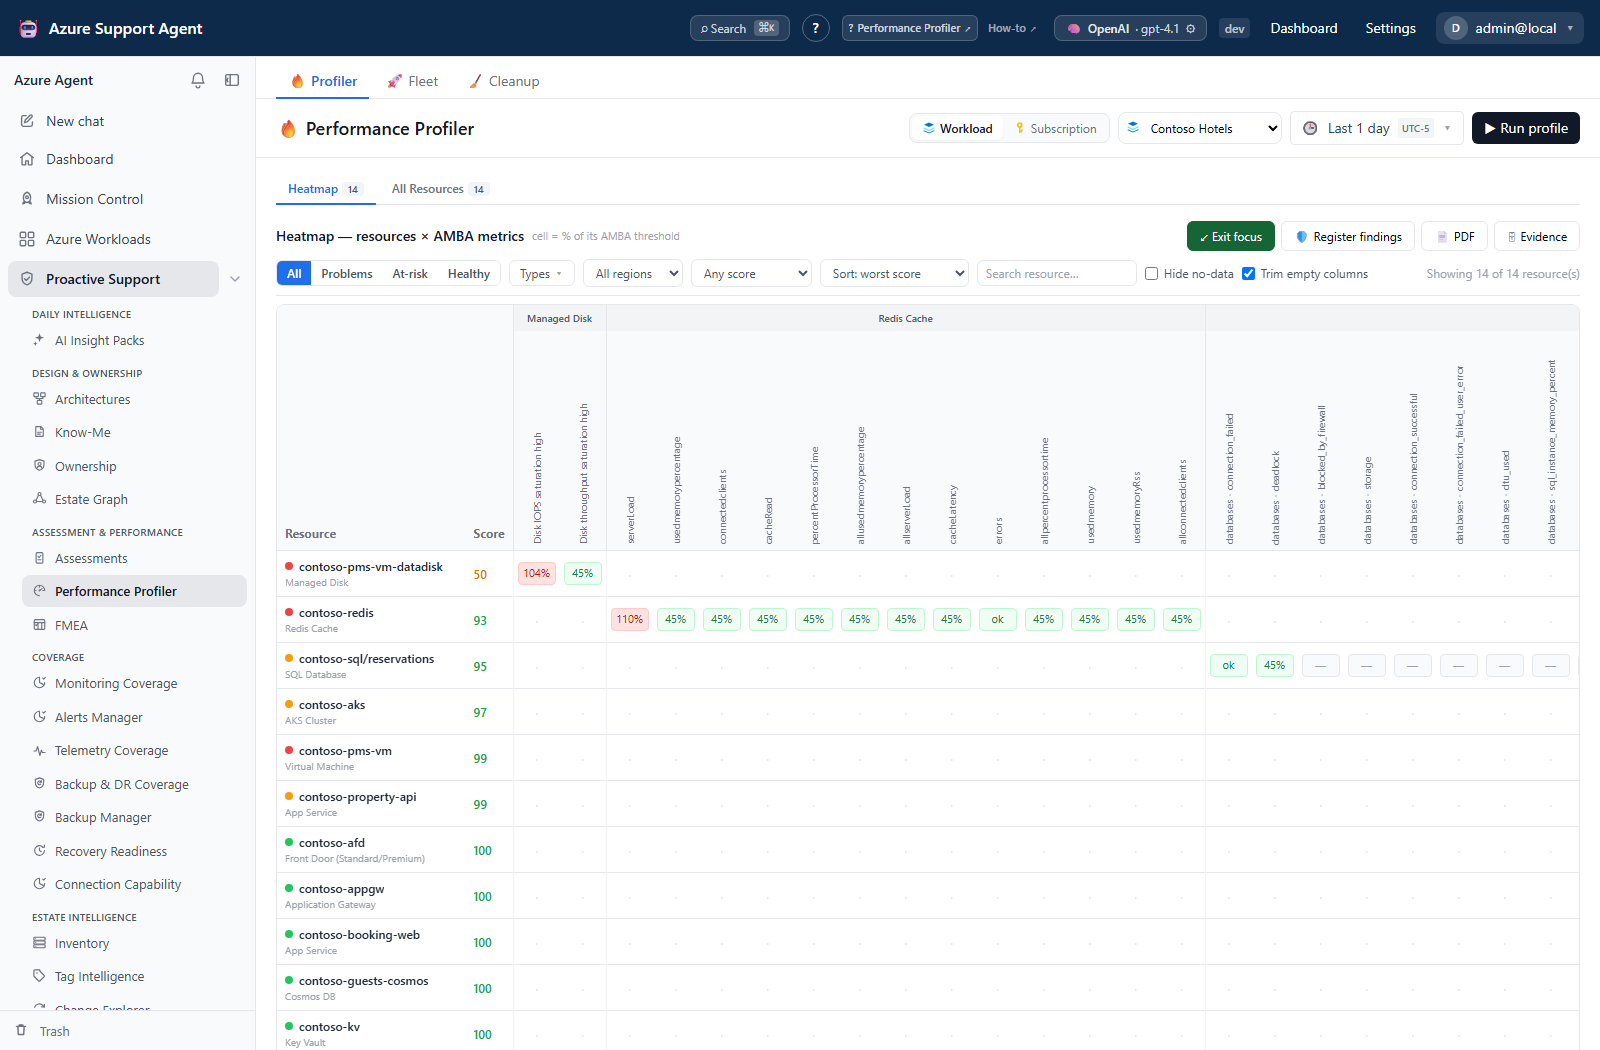
Heatmap shows resource-by-metric cells, resource scores, the binding bottleneck, ranked bottlenecks, filters, and resource detail. All Resources includes in-scope resources that do not have a supported metric definition; those resources are inventory context, not scored rows.
Run actions include:
- open an historical run by its
rundeep link; - download a run-specific PDF;
- capture an immutable Evidence Locker snapshot;
- register current bottlenecks as Performance-pillar findings;
- create a Jira or ServiceNow ticket for a bottleneck;
- hand a bottleneck to the chat War Room;
- move a run to Trash, restore it, or permanently purge it.
Fleet
Fleet reads the newest successful profile for every active workload and overlays the newest attempt status. It supports workload search, sortable score/resource/breach columns, multi-select, one shared time range, and a maximum of 500 workload IDs per submitted batch.
A Fleet submission returns 202 Accepted after creating a SQL-backed batch. The UI polls the latest batch once per second while it is queued or running. Batch and item states are:
queued: persisted and waiting for a worker;running: one worker has claimed the workload;succeeded: collection completed without failed metric checks or a scan-cap truncation;partial: at least one metric check failed or the resource scan cap was reached;failed: collection failed, timed out, or no metric check completed successfully;cancelled: the workload was cancelled before collection started.
Cancel pending marks queued items cancelled. A workload already running is allowed to finish safely. Retry failed/partial creates a new durable batch for failed, partial, or cancelled items; the backend retry preserves the original time window. Tenant-scoped idempotency keys prevent a duplicate submit from creating a second batch.
The SQL batch is independent of profile history. Deleting a terminal batch control record does not delete its completed profile runs.
Cleanup
Cleanup lists active and trashed profiler attempts across all scopes with approximate stored size. Trash is reversible. Purge and empty-trash operations permanently remove run history and cannot be rolled back; Evidence Locker snapshots remain separate artifacts.
Quick-select presets and Retain last N per scope operate across loaded active runs, not only the text-filtered rows. Selection can outlive a search change. Purge permanently is available on active selections as well as Trash, so moving to Trash first is a recommended safeguard, not a required backend sequence. Review the complete selected count before confirming.
Freshness and scope behavior
- Opening
/performancereads history and stored results; it does not start an Azure scan. - The trusted Fleet score, profile fallback, report fallback, cache, and trend use only complete
succeededruns. - Failed and partial attempts remain in history and appear as the latest-attempt overlay. They do not replace the latest successful score, cache entry, or trend point.
- The successful-result freshness default is six hours. Fleet badges a successful result stale after that TTL; a stale badge does not start collection.
- The default metric window is one day, configured interval is 15 minutes, and resource scan cap is 200. A custom start and end must both be supplied, be valid ISO-8601 timestamps, and have start earlier than end.
- The collector uses the coarser of the configured interval and each AMBA alert’s
window_size. For example, an hourly capacity or count check runs atPT1Heven when the configured interval isPT15M; checks whose reference window is finer continue to usePT15M. This changes the aggregation grain for that check, not the selected profile time range. - Resources without a supported reference entry are not scored. If eligible resources exceed the scan cap, collection is
partialand reports the selected and eligible counts. - Run history retains at most 30 active attempts per tenant and scope. Trashed attempts are retained until restored or purged.
Collection completeness
Each attempt records discovered, eligible, selected, and completed resources plus metric-check and request counters. completeness_pct is the percentage of checks that either returned observations or returned a valid no-data result. A request failure is different from no data:
- No data means the metric request completed but produced no observations. It is not counted as healthy and its score is unknown.
- Failed check means the metric could not be evaluated after retries. Missing values from that check must not be interpreted as healthy.
- Partial means some conclusions are available but the attempt is not trusted as current posture.
- Succeeded with an unknown score is possible when all supported requests complete but every metric has no observations.
Workflow overview
- Resolve the scope and open one service-principal Azure CLI session for the profile when service-principal authentication is used. Non-service-principal connections use their supported REST or ambient authentication path.
- Discover resources, select supported types up to the scan cap, and hydrate managed-disk provisioned limits when needed.
- For each resource, group compatible metric checks by metric target, aggregation, dimension filter, and effective interval. Multiple metric names in a compatible group are fetched in one Azure Monitor request and parsed back into separate checks. Managed disks use grouped read/write counters to derive IOPS and throughput saturation.
- Route storage-account service metrics to the Azure Monitor resource identified by
metric_namespace:blobServices/default,queueServices/default,fileServices/default, ortableServices/default. Account-level namespaces continue to query the storage-account resource itself. - Admit every metric request through one process-wide gate shared by Fleet, focused profiler runs, Mission Control, and the profiler agent tool.
- Retry transient
429,500,502,503, and504responses, timeouts, connection resets, and temporary request errors. The collector honors a reportedRetry-After; otherwise it uses exponential backoff with jitter. - Compute resource states and scores, derive collection status, generate the optional narrative, and persist the attempt.
- Replace the trusted cache and append a trend point only when the attempt status is
succeeded.
Interpretation of results
- Breaching means the worst observation crossed the configured threshold.
- Approaching begins at 70% of a higher-is-worse threshold, or within the risk side of the supported operating range for lower-is-worse metrics.
- Healthy means an observation was returned and stayed on the healthy side of that metric’s threshold.
- No data is unknown. A resource with no observed metric cells has a blank score, not
100. - Resource score is severity-weighted: a breach applies the full metric weight and approaching applies half. No-data cells are excluded rather than rewarded.
- Workload score is the average of resource rows with observations. If no row is observed, the workload score is blank.
- A green score does not establish service health. Validate it against SLOs, logs, dependencies, deployment events, and user-impact telemetry for the same window.
Exports, history, scheduling, and integrations
- Full profile attempts are retained on the application’s durable data volume; Fleet batch and queue state are retained in SQL.
- On server startup, an interrupted
runningFleet item is re-queued. Already terminal items are preserved, and an item-specific trigger prevents duplicate history persistence after restart recovery. - PDF reports and Evidence Locker captures can target a specific run or the latest successful run for a scope.
- Findings are stored as a lightweight Performance assessment run. Tickets are real external connector deliveries.
- Register findings is workload-only and uses the currently selected workload plus displayed bottlenecks. When opening a historical
?run=link, confirm the selected workload matches the report before registering findings or using War Room. PDF/Evidence can address the saved run by ID directly. - A registered findings run has
trigger=perfprofile, no overall score, and Performance-only findings; do not rank it as a complete WAF assessment. Evidence capture does not make a partial/failed attempt complete. - Mission Control and the profiler investigation tool use the same execution, timeout, retry, completeness, persistence, cache, and trend rules.
Safety and limitations
- Profiling issues read-only Resource Graph and Azure Monitor requests. Findings, Evidence, and tickets create application or external artifacts but do not tune thresholds or resize Azure resources.
- Default Fleet workload concurrency is
1; the accepted range is 1–3. Starts are separated by 1,000 ms by default. - Azure Monitor request concurrency is process-wide, defaults to
2, and accepts 1–12. It is process-local because the deployed application is designed for one replica; multiple replicas would each enforce their own limit. - Metric attempts default to
3total attempts, including the first, and accept 1–6. Retry exhaustion produces failed checks rather than false green cells. - One workload collection has a default 1,200-second timeout and accepted range of 60–7,200 seconds. A timeout is retained as failed history and does not displace trusted posture.
- A reference
window_sizecan make one metric’s effective interval coarser than the configured interval. Compare values with Azure Monitor at that effective grain; do not assume every heatmap cell used 15-minute buckets. - Raising Fleet or metric concurrency can multiply Azure throttling and Azure CLI processes. Increase gradually and observe collection counters and host capacity.
- Changing Fleet workload concurrency changes worker count only after an application restart. Start delay, metric concurrency, attempts, and workload timeout are read during subsequent work.
- Single-scope browser progress is not the durable Fleet queue. A browser disconnect can lose progress while the server task continues and saves history; it does not provide focused-run restart recovery. Use Fleet for durable queue tracking and server-restart recovery.
Troubleshooting
| Symptom | Cause and resolution |
|---|---|
| A Fleet batch remains queued | Confirm database migration 0007_perf_profile_fleet is applied and the profiler Fleet worker started. Verify the workload still exists and the batch was not cancelled. Restarting the application reclaims durable queued work. |
| A batch reappears as queued after a server restart | The worker deliberately re-queues an interrupted item. Continue polling; completed items are not repeated, and the item trigger prevents a duplicate run record. |
| Performance profile stream disconnected before completion | The stream ended without a terminal event. The local running indicator clears and history/Fleet refresh, but server collection may still finish. Reopen Profile history and match the scope/time window before retrying; use Fleet when durable queue tracking is required. |
| Cancel pending leaves one workload running | Cancellation affects queued items. The already claimed workload finishes unless server shutdown interrupts it; wait for the terminal batch status. |
| Metric counters show throttling or transient failures | Review metric_requests_throttled, retries, and the bounded error list. Lower process-wide metric concurrency, increase Fleet start delay, allow Retry-After to elapse, and retry failed/partial items. |
| The latest attempt is partial but Fleet still shows an older score | This is intentional reliability behavior. Open the partial attempt to review completeness/errors; the score, cache, and trend remain on the latest complete success until a new successful run finishes. |
| The attempt succeeded but score is blank | Requests completed but all supported metric cells had no observations. Check Azure Monitor metric support, window, aggregation, provider delay, and access; unknown is not 100. |
| Cleanup selects more than the visible filtered rows | Presets work across loaded scopes and selections can remain while searching. Clear selection, use Select all shown for the intended subset, and review the confirmation count before purge. |
Storage capacity or count metrics show no data or BadRequest | Confirm the active AMBA entry has the service-level metric_namespace and its supported window_size. Storage blob, queue, file, and table metrics are automatically sent to their /blobServices/default, /queueServices/default, /fileServices/default, or /tableServices/default target, and a coarser reference window widens only that check’s interval. |
| Every metric check failed or the workload timed out | Validate the Azure connection, Resource Graph access, Azure Monitor metric access, service-principal credentials, and host az availability. Narrow the scope/window or adjust the bounded timeout before retrying. |
| A service principal authenticates repeatedly during one profile | The collector should open one temporary session per profile and reuse it. Check worker logs for session setup failures; a failed login prevents reuse and produces a retained failed attempt. Temporary sessions also reuse the stable local Azure CLI extension directory, while the production image uses its baked extension directory. |
| Changing Fleet workload concurrency has no immediate effect | Worker count is created at application startup. Save the setting, restart the application, and verify that the SQL-backed batch resumes before increasing load further. |