Telemetry Intelligence
Permission: teleintel.read for every Telemetry Intelligence endpoint, including query execution, finding registration, ticket creation, and demo seeding. The name does not mean all actions are application-read-only.
Purpose
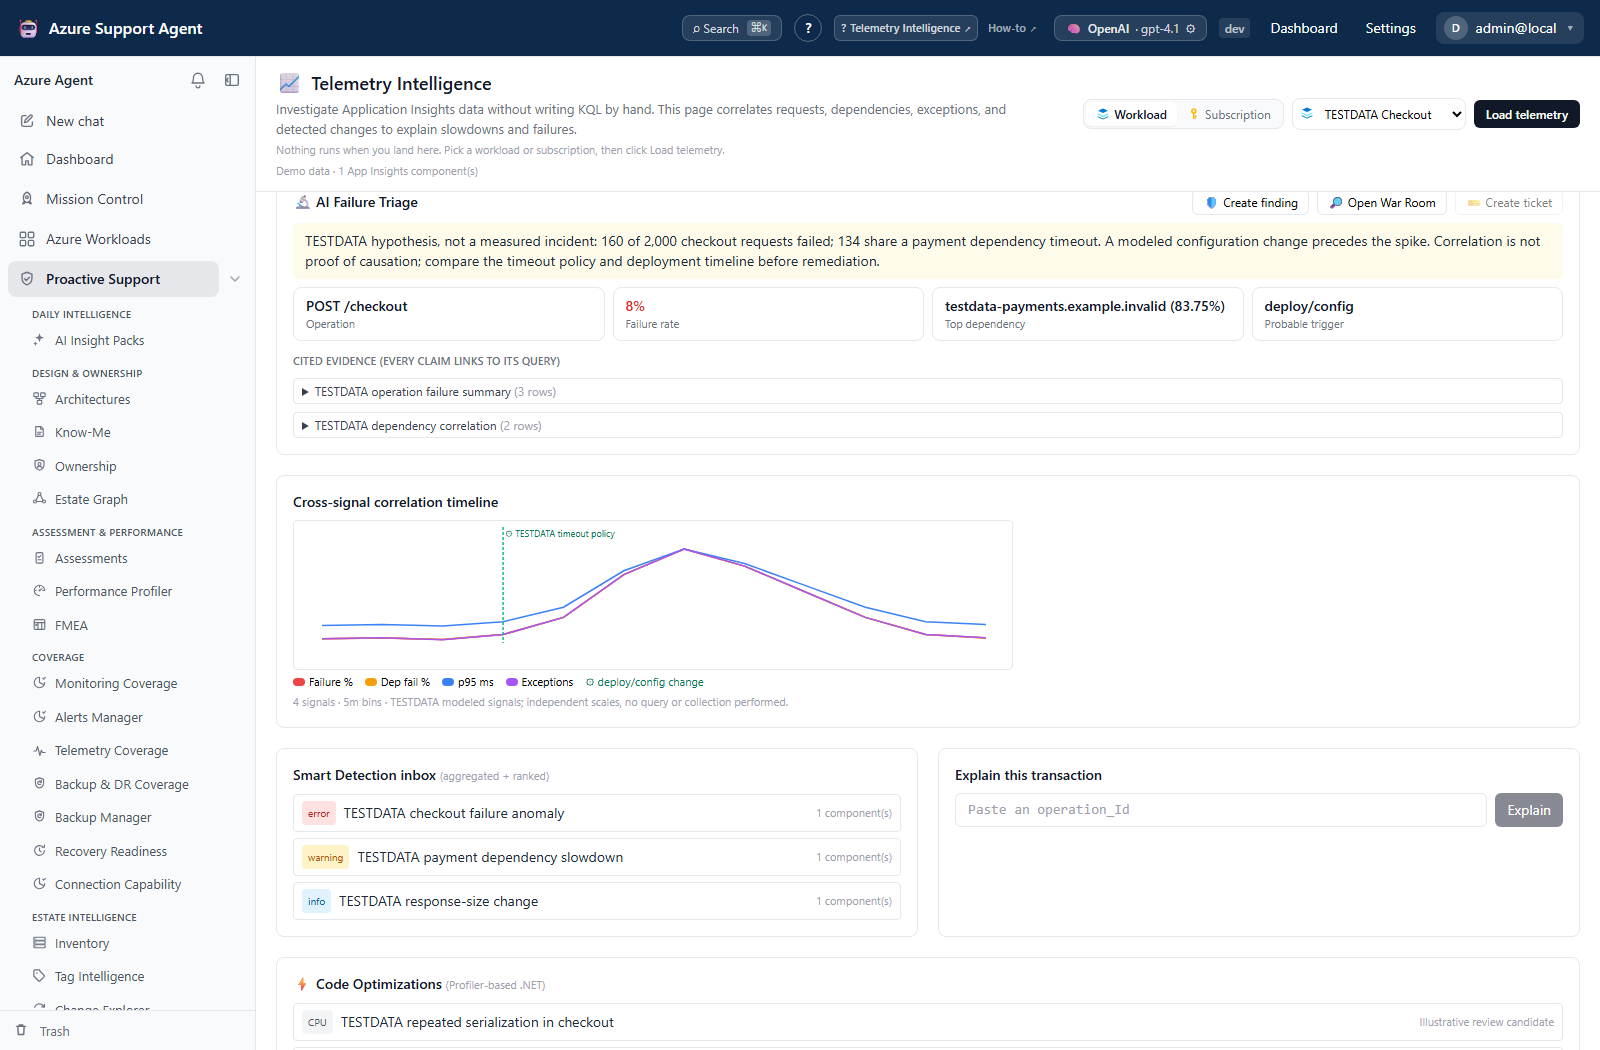
App route: /telemetry-intel Telemetry Intelligence queries Application Insights components for a workload or subscription. It exposes the generated KQL and source rows alongside AI triage, timelines, Smart Detection aggregation, transaction reconstruction, and code-optimization suggestions.
Prerequisites and data sources
The selected connection must discover Application Insights resources and query their telemetry. The current query runner needs a supported Azure CLI authentication path, command execution enabled, and az allowed; a working Resource Graph connection or pasted ARM token alone does not establish Log Analytics/Application Insights query access. An AI provider is needed for natural-language translation and used for triage/transaction narration. Code Optimizations is a source-data feature, not an AI-generated patch.
How to load a scoped telemetry review
- Choose a workload or subscription and verify its connection. The scope pickers need
workloads.readin addition toteleintel.read. A workload’s configured connection is authoritative. Scope is remembered, but page entry does not start telemetry queries. - Select Load telemetry to enable overview, failure triage, timeline, Smart Detection, and Code Optimizations requests. Changing scope/connection requires activation again. These are sections on one page, not separate Triage/Timeline tabs or run buttons.
- Check component count and any discovery/query error. Discovery considers up to 50 components; most analyses choose the first returned component. There is no component or time-window selector in this UI. Smart Detection alone aggregates across the discovered components.
- Verify the telemetry boundary independently. Component discovery uses the membership predicate without applying per-membership workload exclusions. Workspace-based components query their linked Log Analytics workspace; classic components query by AppId. The workspace path does not automatically add a component/resource filter, so a shared workspace can include another application’s telemetry.
Expected result: A deliberately activated telemetry review with known source and scope limits, not a complete fleet correlation.
Verification: Confirm the operation/component represented by the evidence and inspect query predicates. The backend’s default query timespan is P1D (24 hours). The timespan/cache/row settings exist in backend configuration but are not exposed by the current settings-update schema; this page cannot change them. Loaded sections use client query caching and can refetch after activation; clicking Load telemetry again is not a dedicated force-refresh operation.
How to ask a question and validate the resulting query
- Enter a narrow, sanitized question in Ask your telemetry, such as “Which operations had failed requests in the last hour?”, and select Ask. Example-question chips also submit immediately.
- Follow generated KQL, returned rows, and answer. Ask drafts, validates, and executes automatically; it does not pause for approval before query execution.
- Inspect predicates, time limits, joins, and the source rows before accepting the answer. The narrative uses a sample of up to 30 rows; visible result tables show only the first 200.
- Edit Generated KQL and select Run for a direct query. Successful rerun replaces rows and clears the earlier narrative; it does not generate another answer.
- For a non-default subscription connection, do not assume Run uses the same identity as Ask. The edited-query request schema does not accept
connection_idand falls back to the default connection for subscription scope. Use the connection-aware Ask path or an independently verified query environment instead of trusting mismatched results.
Expected result: Inspectable query evidence and a separately evaluated explanation; telemetry is read, not remediated.
Verification: Compare counts/timestamps with source data. Ask slices returned rows to teleintel_max_rows (default 1,000), but the validator only appends a cap when no take, limit, or top exists. Edited queries are not subsequently sliced to that setting. Use an explicit small final limit; do not treat the setting or 200-row display as a universal hard cap. Validation is heuristic and does not replace least-privilege telemetry access.
How to interpret triage, timeline, and transaction evidence
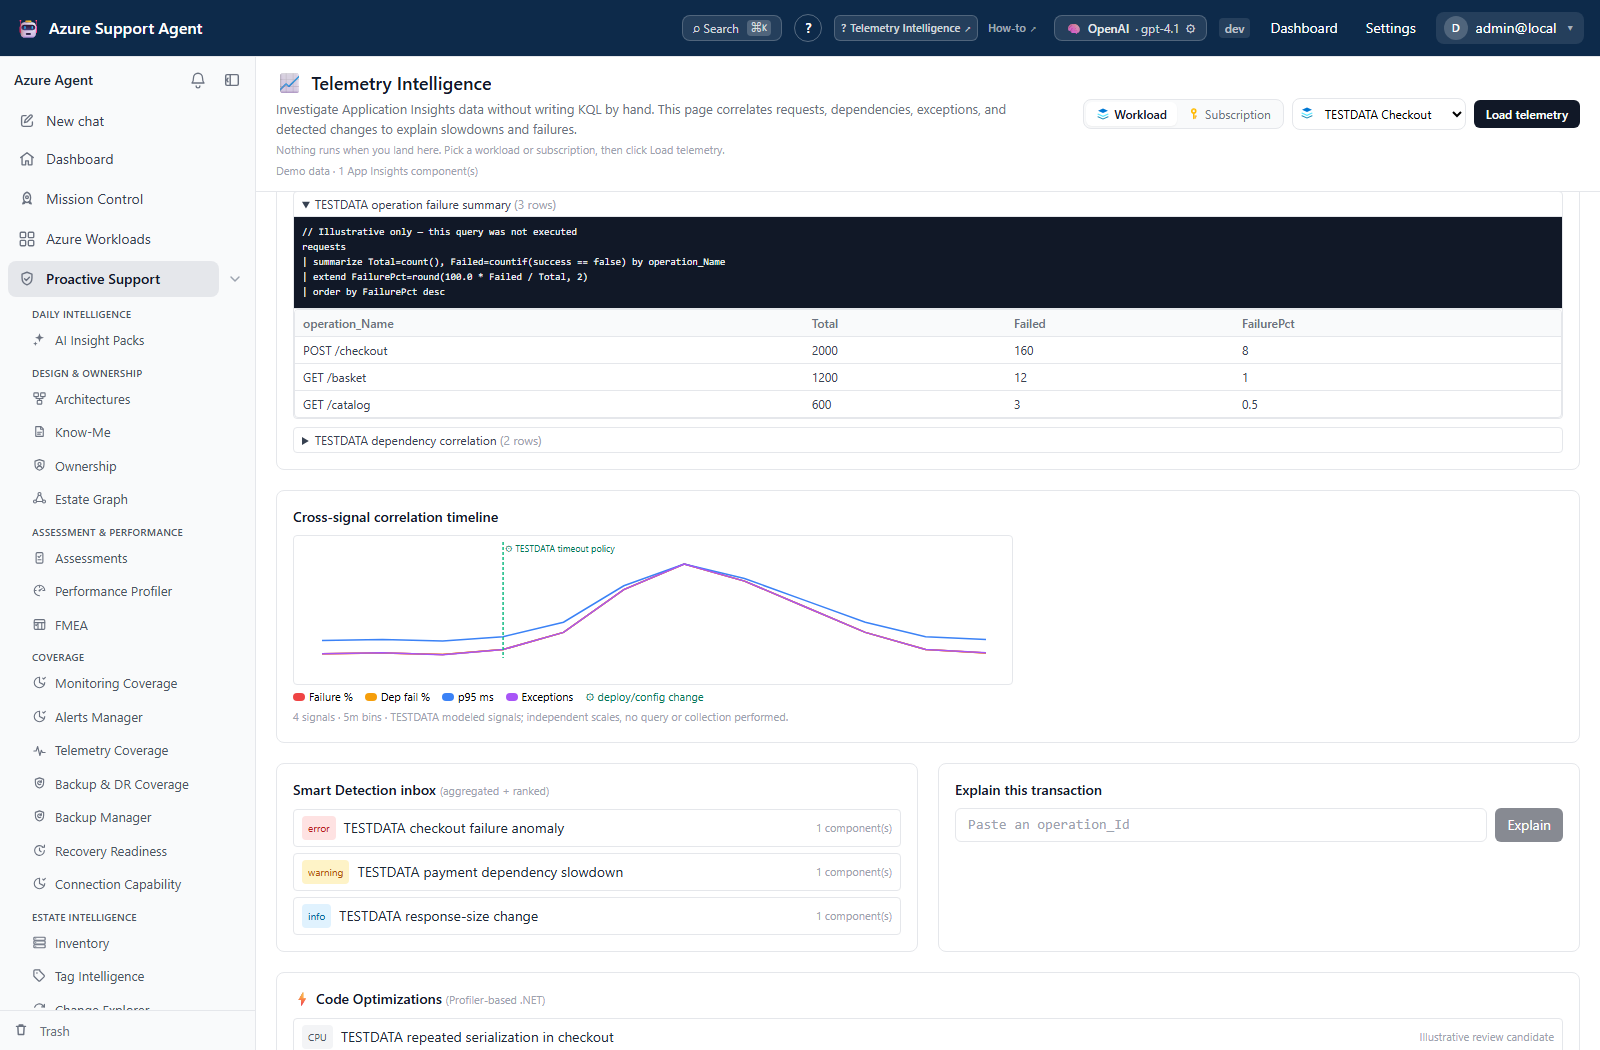
- In AI Failure Triage, expand Cited evidence for the failing-operation, dependency, and exception queries. A warning marks a failed query. “Failure spike” here means a returned operation has failures; it is not a measured deviation from a historical baseline.
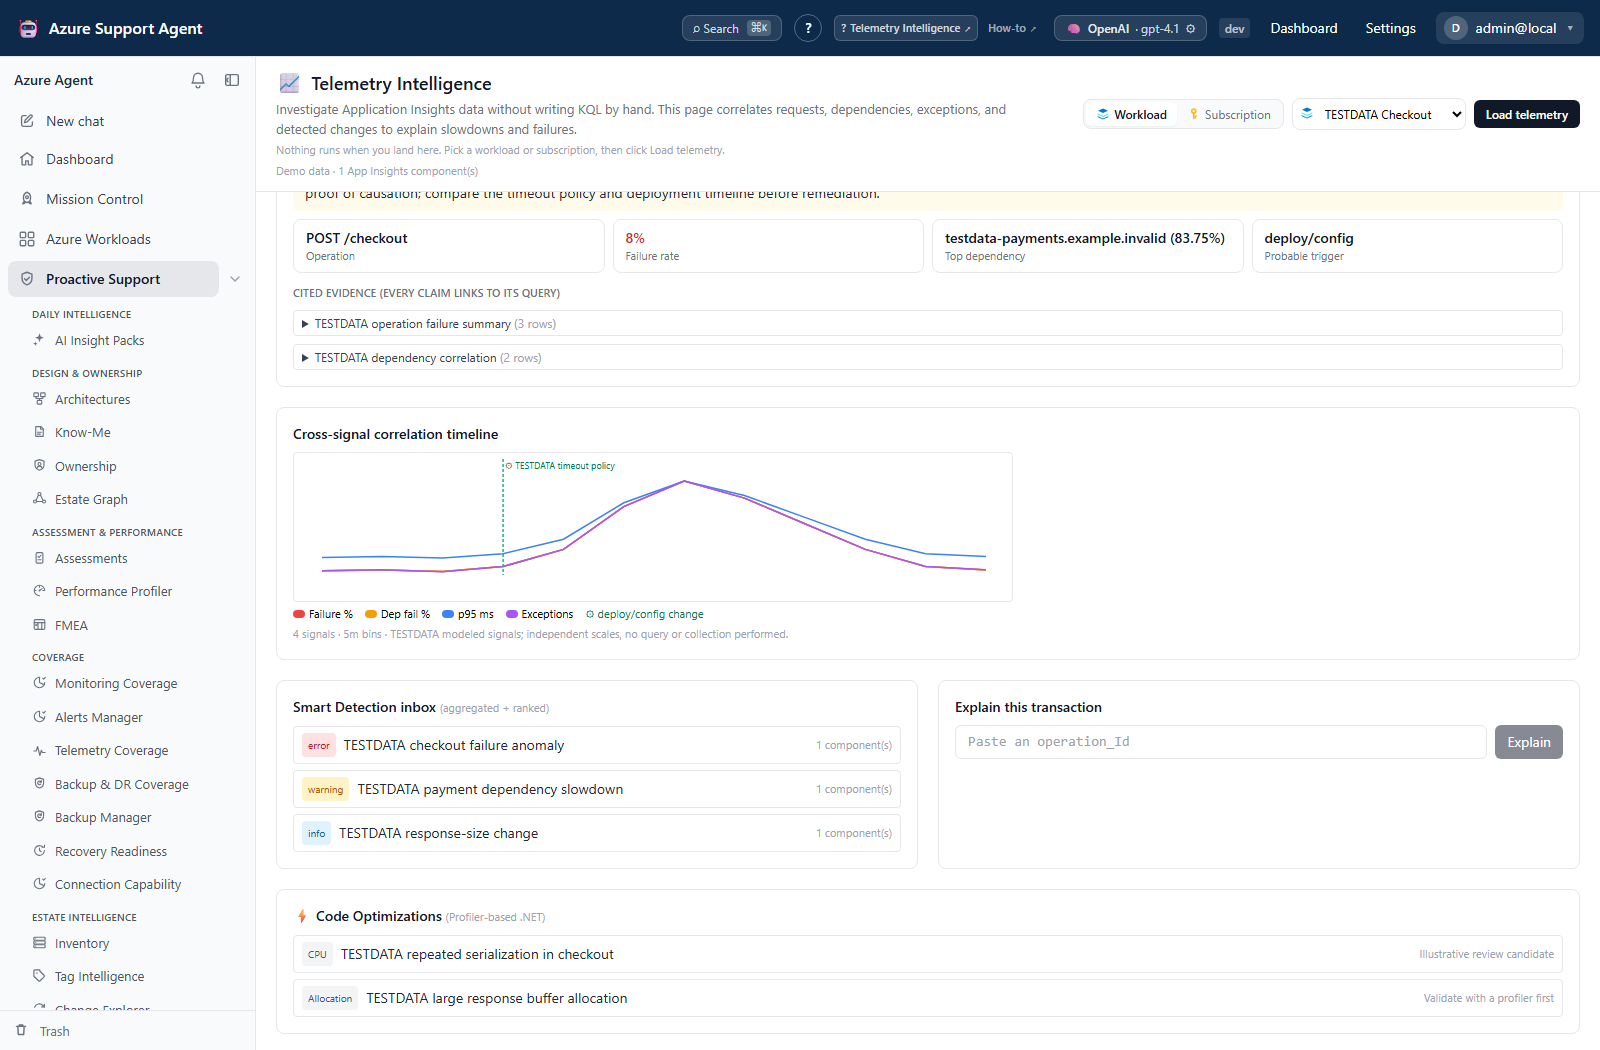
- Compare the Cross-signal correlation timeline with source rows. Failure rate, dependency failure rate, p95 latency, and exception count use five-minute bins; each plotted series is scaled independently, and missing values can appear as zero. Read notes about unavailable signals.
- Validate any probable trigger separately. Triage chooses a recent change from a 24-hour query, and timeline overlays use a 48-hour query; neither currently applies the resolved workload/resource predicate to the change query. Proximity and correlation are hypotheses, not causal proof.
- Read Smart Detection inbox as grouped enabled proactive-detection configuration, with severity inferred from rule names, not proof that each rule fired recently. An empty inbox can mean unavailable access or disabled command execution.
- Enter an
operation_Idin Explain this transaction and select Explain. Review ordered request/dependency/exception/trace spans, result codes, and narration. The transaction is capped at 500 rows; displayed total time sums request/dependency durations and can double-count nested or overlapping work. - Review Code Optimizations only when source items are returned. They are best-effort Profiler-based .NET suggestions; the section is hidden when empty and does not apply code changes.
Expected result: An evidence-backed hypothesis and bounded transaction reconstruction with gaps made explicit.
Verification: Check operation IDs, raw span times, source query success, sampling, ingestion delay, and retention. Explain, like edited Run, does not preserve an explicit subscription connection ID in its backend schema. No-data/error results or a wrong component are not proof that an incident did not occur.
How to preserve findings and recover an interrupted review
- When triage shows failures, choose Create finding in workload scope to save a new assessment run. Repeated clicks create new runs; the operation does not perform remediation or automatically attach evidence to a case.
- Select Open War Room to prefill a deep-investigation composer; review before launching with
chat.use. Workload handoff can best-effort create/update a Case File, requiring case permissions separately. - Select Create ticket and an enabled Jira/ServiceNow connector only after reviewing the hypothesis and first three evidence queries. The picker additionally requires
connectors.manage, although the creation endpoint is guarded only byteleintel.read. Selection creates an external ticket immediately; there is no separate approval step, text editor, or ticket undo here. If automatic ticket content is unsuitable for disclosure, use a separately reviewed manual handoff instead. - Record reviewed queries, timestamps, and conclusions in a case or approved evidence artifact. This view has no query-history, download, import, schedule, or snapshot-attachment control. Evidence Locker is a separate workflow; its metrics checkbox is not a copy of these query results.
- If an Ask stream fails, retain any received KQL/rows as partial evidence and inspect the error. Correct the connection/query/provider cause and submit a new request deliberately. There is no durable replay or resume control for this stream; page-local question/answer/transaction state is not a retained investigation record.
Expected result: A saved application finding/case note or external ticket, without confusing a transient query result with durable history.
Verification: Confirm the destination record and its scope before repeating a request with an uncertain outcome. Queries/results can contain customer or personal data; minimize disclosure. Code/configuration remediation and rollback require the normal approved process outside Telemetry Intelligence.
Troubleshooting
| Symptom | Cause and resolution |
|---|---|
| No components | Verify workload scope, subscription, component existence, and connection access. |
| Generated query rejected | Remove unsupported tables/operators or statement batching and use a narrow predicate/final limit. The validator also rejects queries longer than 8,000 characters. |
| Discovery works but queries fail | Check command-execution policy, allowed az, CLI availability, authentication path, and telemetry data-plane access. An ARM-only token is insufficient for Log Analytics/Application Insights queries. |
| Query times out | Narrow operation/time predicates within the configured window; there is no page-level component/timespan picker. Ask the administrator to investigate source/provider errors. |
| Transaction not found | Confirm the first selected component, operation_Id, default-connection fallback, sampling, ingestion delay, and retention. The page may render no transaction card for an empty span result. |
| Smart Detection or Code Optimizations empty | Check command execution, component configuration, source permissions, and Profiler support; these are not certificates of no anomalies or no optimization opportunities. |