General settings
App route: /admin/settings
Product permissions: settings.read to inspect; settings.write to change
Purpose
General settings is the runtime policy surface for chat behavior, deep investigation, write-tool safety, host command execution, policy exemptions, Change Explorer limits, Resource Graph pacing, and Performance Profiler capacity. Saving updates application configuration and the Audit Log; it does not itself mutate Azure.
Prerequisites and data sources
- Record the current values, approved reason, affected workflows, and a bounded verification before changing settings.
- Create an application backup before a broad or high-impact change.
- Values are loaded from the application settings store. The backend validates the whitelisted update model and clamps supported numeric ranges.
- Review changes at
/admin/audit; a successful save recordssettings.update.
Tabs and actions
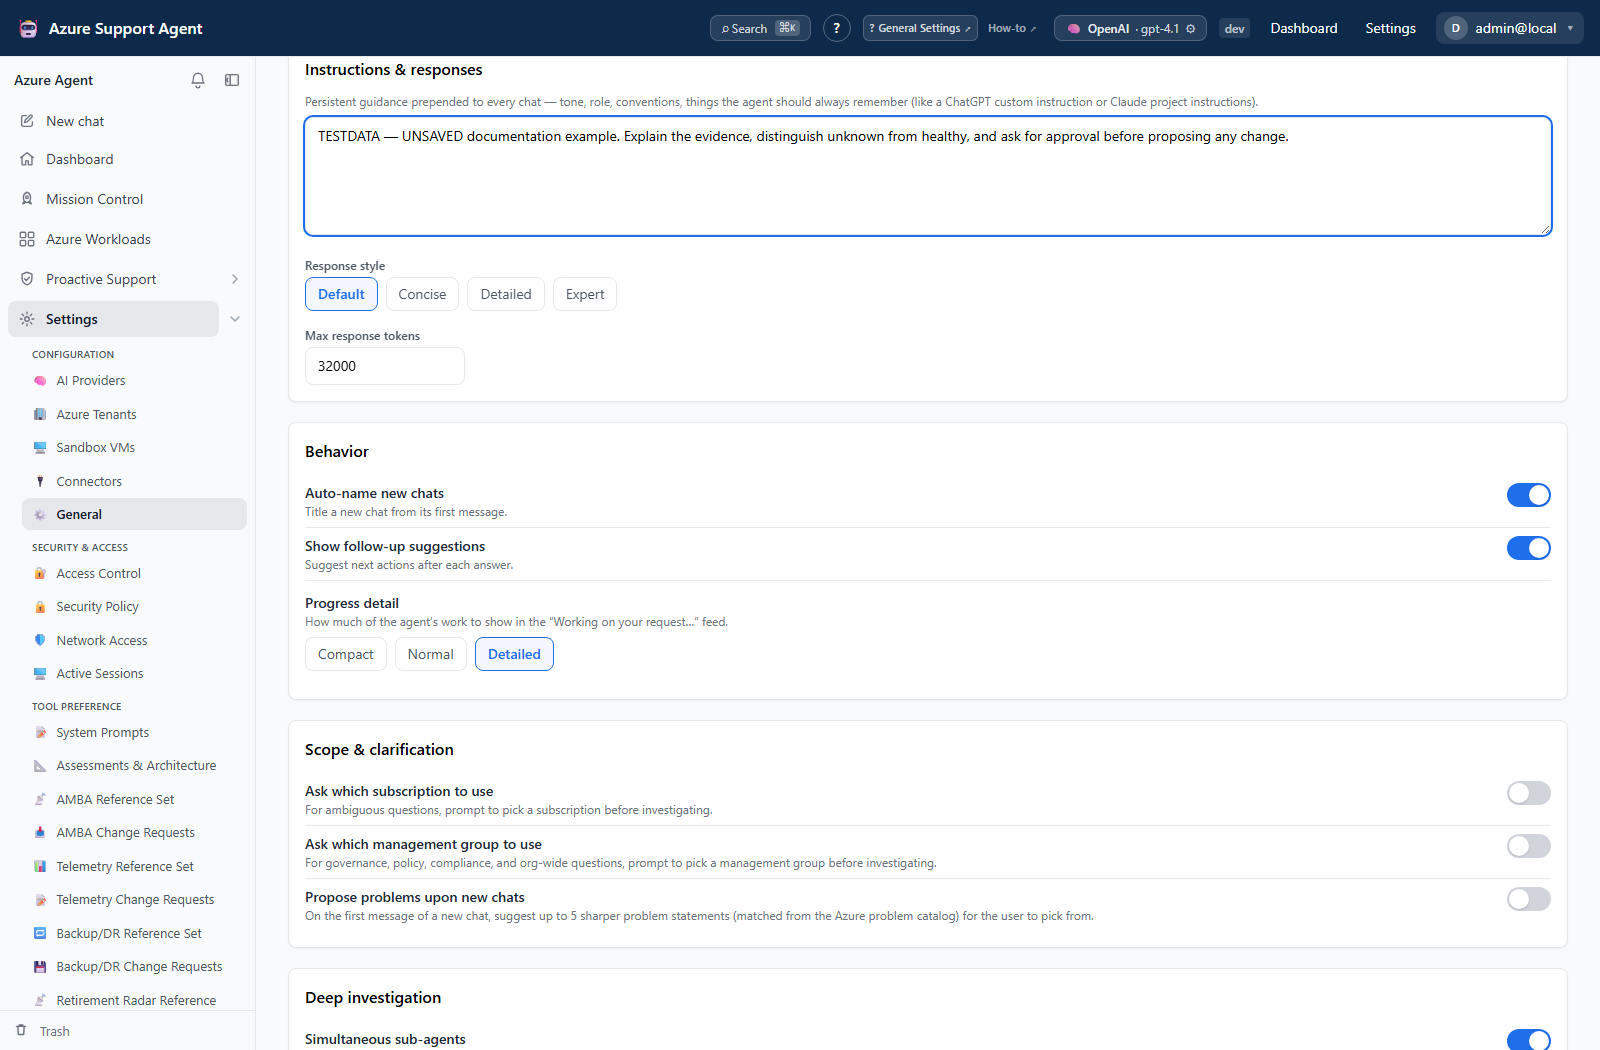
The single scrolling page contains:
- Instructions & responses:
custom_instructions,response_style, andmax_tokens. - Behavior:
auto_title,suggestions, andprogress_detail. - Scope & clarification:
scope_clarification,mgmt_group_clarification, andpropose_problems. - Deep investigation:
deep_parallel_enabledanddeep_parallel_count. - Tool Safety:
mcp_read_onlyandauto_execute_writes. - Host command execution:
command_execution_enabled,command_allowlist, andcommand_timeout_seconds. - Advanced agent tuning:
max_tool_iterations,tool_result_limit,tool_discovery_limit, andrequest_timeout_seconds. - Policy exemption guardrails: justification, expiry cap, and never-expiring controls.
- Change Explorer: identity resolution and per-source change cap.
- Performance Profiler capacity: durable Fleet and Azure Monitor safety controls.
- Azure Resource Graph pacing: application-side per-principal query pacing.
Select Save settings, then reload the page to confirm the effective values returned by the backend.
With settings.read but not settings.write, the page displays a read-only banner and disables the settings fieldset. A direct PUT still requires settings.write at the backend.
Performance Profiler capacity
| Visible control | Saved key | Default | Accepted range | Runtime behavior |
|---|---|---|---|---|
| Fleet workloads in parallel | perfprofile_fleet_concurrency | 1 | 1–3 | Number of durable Fleet worker tasks. The worker reads it at application startup. |
| Delay between Fleet starts | perfprofile_fleet_start_delay_ms | 1,000 ms | 0–30,000 ms | Minimum spacing between new workload starts across Fleet workers. Read before each start. |
| Azure Monitor calls in parallel | perfprofile_metric_concurrency | 2 | 1–12 | Process-wide gate shared by Fleet, focused runs, Mission Control, and profiler agent tools. Read while admitting requests. |
| Metric request attempts | perfprofile_metric_max_attempts | 3 | 1–6 | Total attempts including the first for transient or throttled metric requests. Read per profile. |
| Workload timeout | perfprofile_workload_timeout_s | 1,200 s | 60–7,200 s | Collection ceiling for one workload. A timeout is retained as failed history. |
These controls do not change the profiler’s one-day default window, 15-minute interval, six-hour successful-result TTL, or 200-resource scan cap. Those values exist as backend defaults but are not editable controls in the current General settings UI or update contract.
Resource Graph pacing
arg_rate_limit_enabled defaults on. arg_max_queries_per_window defaults to 12 and accepts 1–100; arg_rate_window_seconds defaults to 5 and accepts 1–60. On PostgreSQL deployments, Resource Graph query starts for the same Azure principal are spaced through a cross-replica advisory lock; SQLite/local development retains process-local pacing. Resource Graph pacing and Performance Profiler metric concurrency protect different Azure services and should be tuned independently.
Freshness and scope behavior
- Most values are loaded by subsequent requests or work items, so they do not rebuild an in-flight operation.
- Fleet workload concurrency is an exception. Worker task count is created during application startup; saving a new value requires a restart before worker width changes.
- SQL-backed profiler Fleet batches survive the restart needed for that change. An interrupted running item is re-queued and terminal items remain complete.
- Metric concurrency is process-wide but process-local. The current deployment assumes one application replica; additional replicas would each enforce their own gate.
- Prompt, score, category, connector, Entra, retention, quota, reservation, and other feature-specific settings live on their owning admin pages or are not exposed by this update contract. Do not infer an editable General control from a backend default key.
Workflow overview
- Record the current value, expected effect, and rollback value.
- Change the smallest related set.
- Save, reload, and confirm backend-normalized values.
- Restart only if
perfprofile_fleet_concurrencychanged. - Exercise one bounded representative workflow.
- Compare safety gates, output truncation, timeouts, throttling, partial results, and host load with the baseline.
- Review
/admin/audit. - Restore the recorded values, restart when required, and repeat the same verification to roll back.
Interpretation of results
- A green save banner proves the update request succeeded; it does not prove that an in-flight operation was rebuilt or that a startup-only setting is active.
- More deep sub-agents, Fleet workers, or tool steps can increase latency, token use, Azure requests, and host load.
- Higher retry attempts or timeouts extend the worst-case failure duration. Profiler retries honor
Retry-Afterwhen available. mcp_read_onlycontrols which Azure MCP tools are exposed. If write tools are exposed,auto_execute_writesdetermines whether the agent pauses for approval.- Command execution remains constrained by the allowlist, timeout, read-only connections, mutation classification, and audit behavior.
Exports, history, scheduling, and integrations
General settings has no dedicated revision browser or export. Use Backup & Restore before broad changes and Audit Log for change history. Profiler batches, attempts, PDFs, Evidence, and tickets are managed at /performance.
Safety and limitations
- Keep
mcp_read_onlyon andauto_execute_writesoff unless an approved equivalent control exists. - Keep Fleet workloads at
1and Azure Monitor calls at2until a bounded measurement demonstrates headroom. - Do not increase profiler attempts, concurrency, and timeout together; that obscures which change caused throttling or a longer failure window.
- A process-local metric gate is not a distributed quota. Do not scale application replicas without a distributed admission mechanism.
- Custom instructions are executable policy. Never store credentials, tokens, personal secrets, or tenant-specific identifiers in them.
Troubleshooting
| Symptom | Cause and resolution |
|---|---|
| Fleet still uses the old workload concurrency after save | Worker width is created at startup. Restart the application, reopen /performance, and verify the durable batch resumes. |
| Profiler partial or failed counts rise after tuning | Lower perfprofile_metric_concurrency, restore or increase the start delay, and inspect throttle, retry, timeout, and failed-check counters. |
| A workload fails at a consistent duration | Compare duration with perfprofile_workload_timeout_s; validate access and narrow the scope before increasing the ceiling. |
| Metric failures take much longer after a settings change | perfprofile_metric_max_attempts is total attempts and applies backoff. Restore the previous count or shorten the test scope. |
| A numeric value changes after save | The backend clamps it to the accepted range. Use the reloaded value as effective configuration. |
| A write tool disappears | Check mcp_read_only, the selected connection, and the tool’s own admin page. |
| An existing chat ignores a behavior change | Start a new operation; existing AI context and in-flight work are not rebuilt. |