Investigate telemetry with Telemetry Intelligence
Route
Open /telemetry-intel.
Prerequisites
- Product permission
teleintel.read. workloads.readfor scope pickers,connectors.managefor the ticket picker, andchat.useto open War Room. Finding/ticket API authorization itself remainsteleintel.read.- A connection that can discover and query Application Insights/Log Analytics data, with a supported CLI authentication path, command execution enabled, and
azallowed. ARM-only query access is not sufficient. - An enabled AI provider for natural-language KQL and narration. Code Optimizations comes from the source service, not an AI-generated patch.
- A justified time window and organizational approval to handle telemetry data.
How to ask a telemetry question and validate KQL
-
Open
/telemetry-intel, select workload or subscription and verify the connection, then select Load telemetry. The UI has no component/timespan picker: most requests use the first discovered component and the configured default window (P1Dby default). - Ask a precise, sanitized question. Ask and example chips draft, validate, and execute automatically; there is no approval pause before the query runs.
- Follow streamed start, generated KQL, rows, and answer events.
- Read the KQL, component, timespan, predicates, joins, and limits before accepting the narrative. Component discovery does not apply per-membership workload exclusions; independently verify that the chosen component belongs in this investigation.
- Edit Generated KQL and select Run for narrower predicates and an explicit final row limit. This replaces rows and clears the previous answer without generating a new narrative. For non-default subscription connections, use Ask or a separately verified query environment: the edited-query backend schema drops
connection_idand uses the default connection. - Compare the narrative with raw rows.
Expected result: Bounded read-only KQL, source rows, and an AI summary.
Verification: Manually confirm key counts/timestamps in the rows. Ask caps returned rows at the configured maximum (default 1,000), while tables display only 200 and narration samples at most 30. Existing take/limit/top clauses are not reduced by validation, and direct Run does not apply Ask’s final slice. Shared-workspace queries do not automatically add a component filter; verify application/role predicates before attributing results to one workload.
How to triage and correlate an incident
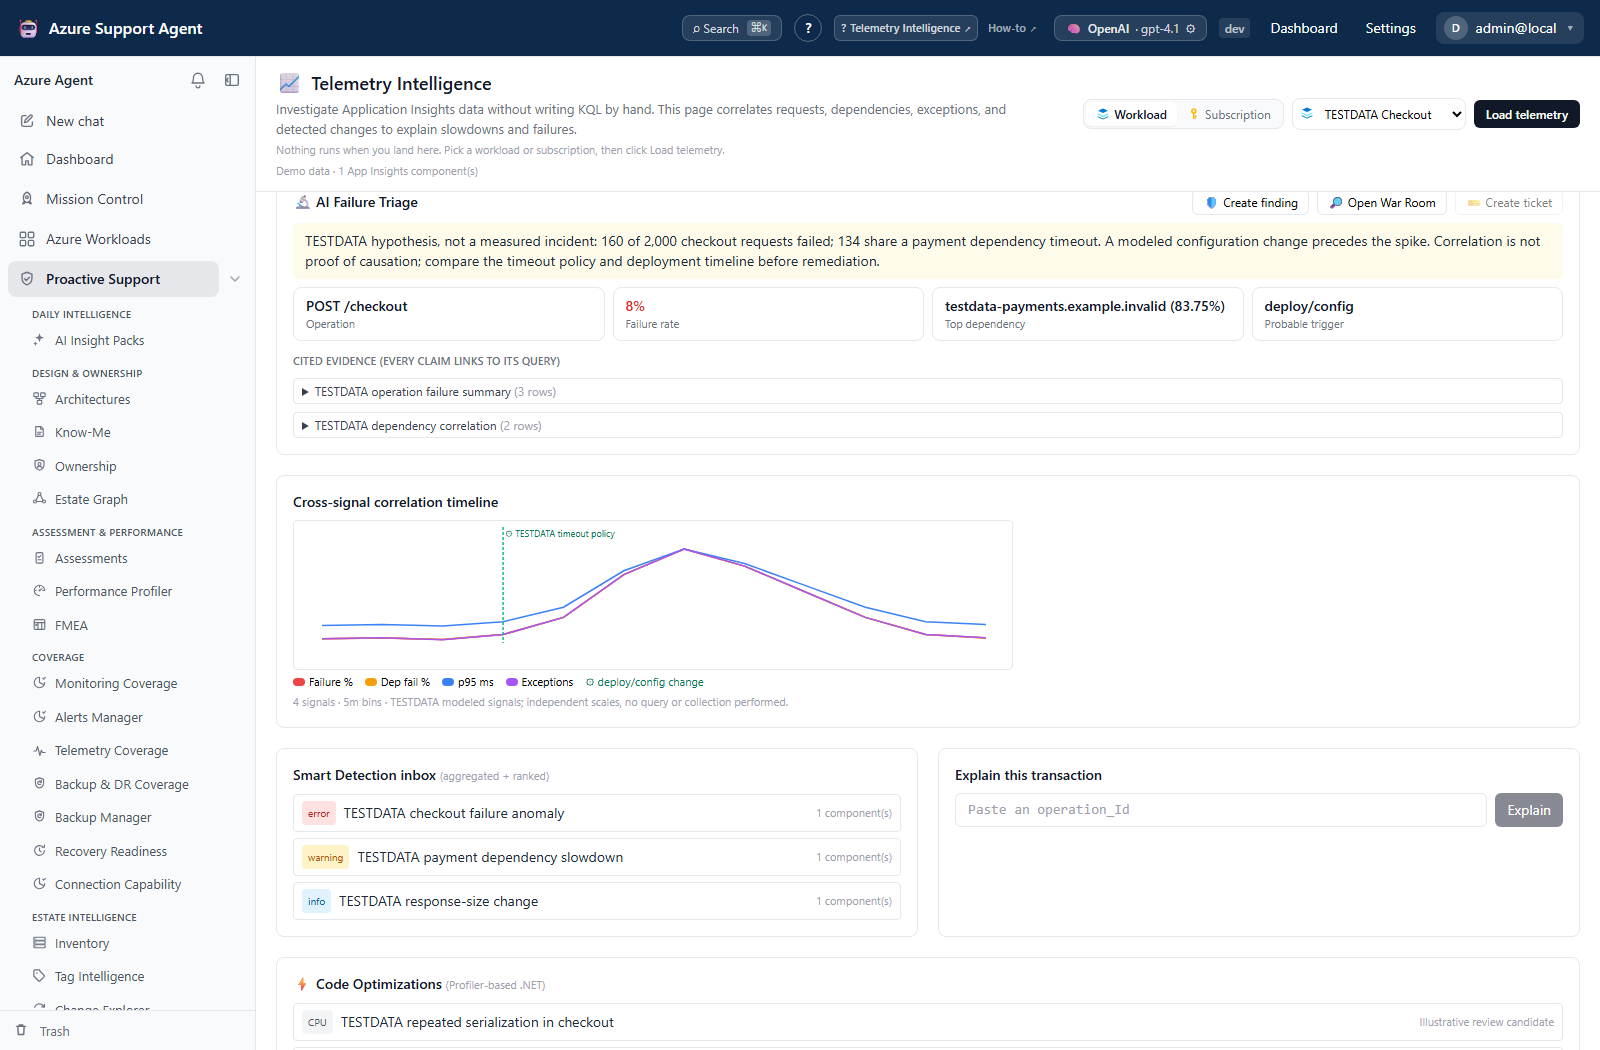
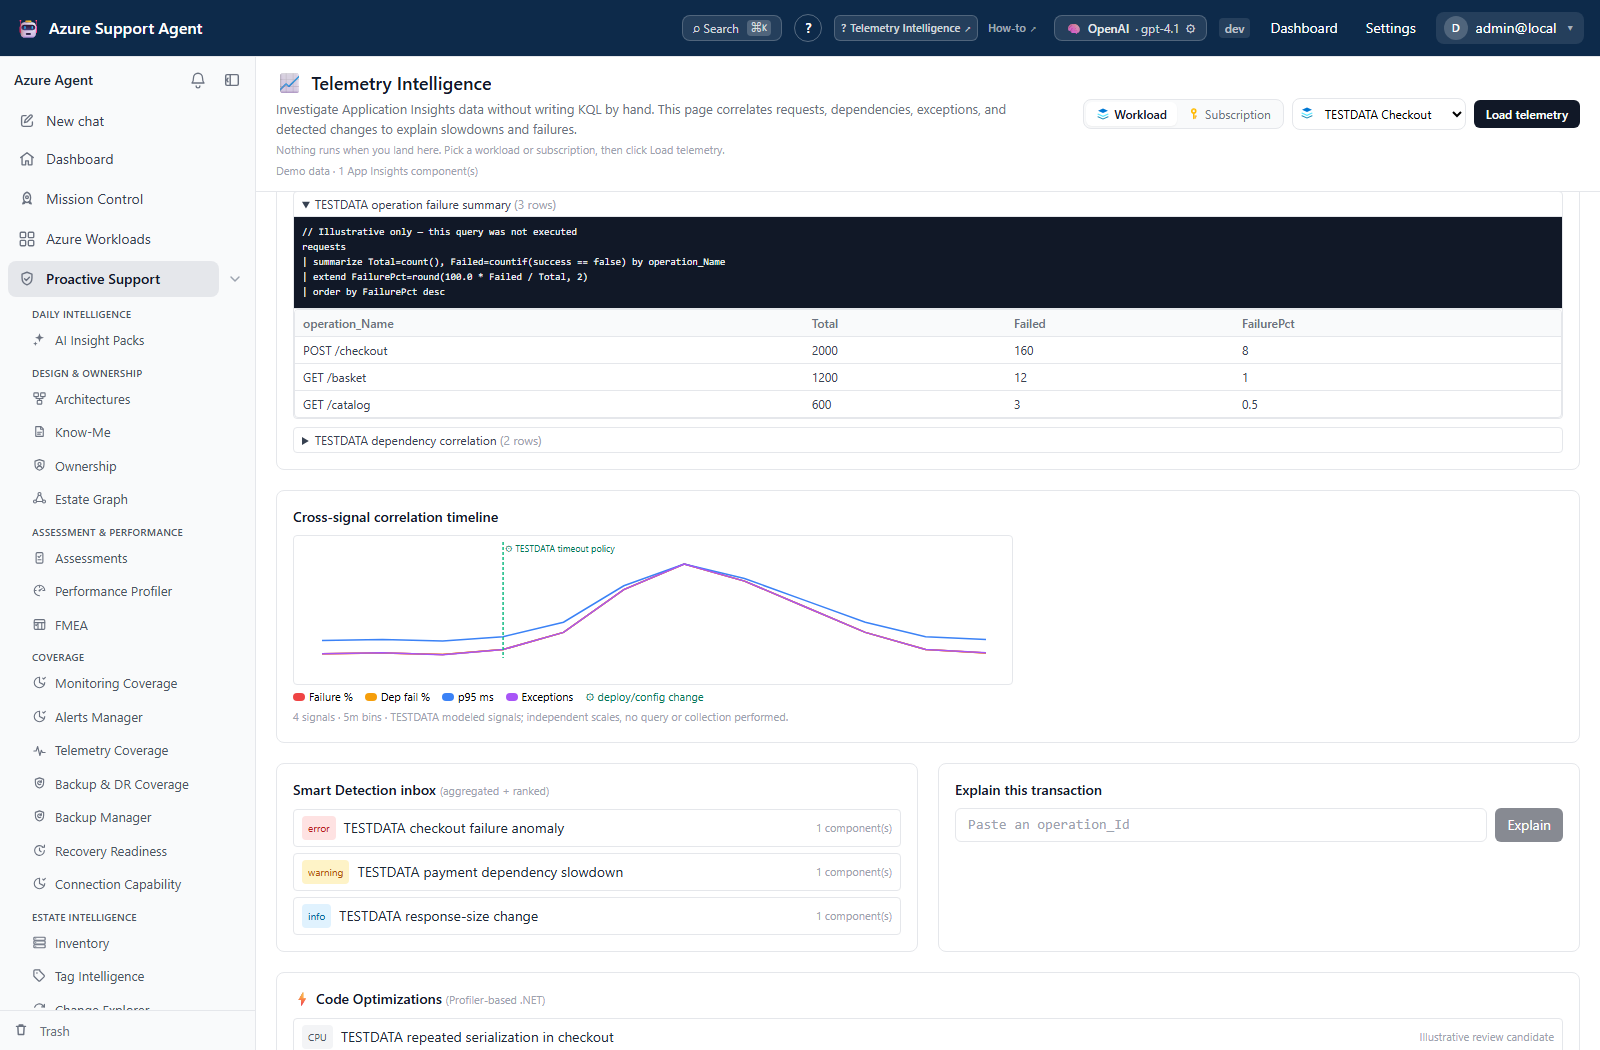
- After Load telemetry, review AI Failure Triage and expand Cited evidence for operation, dependency, and exception queries. These are page sections, not separate run buttons. “Spike” means a returned operation has failures, not a demonstrated baseline deviation.
- Read Cross-signal correlation timeline and its missing-signal notes. Each series is scaled independently; missing values may plot as zero, so compare raw values rather than line heights across units.
- Review Smart Detection inbox as aggregated enabled detector configuration across discovered components. Name-derived severity and presence in this inbox do not prove a recent firing.
- Treat correlation and probable trigger as hypotheses.
- Validate against deployment records, Change Explorer, configuration history, and raw telemetry. Triage’s latest 24-hour change and the timeline’s 48-hour changes are not filtered by the workload/resource predicate; verify each change target independently.
Expected result: A ranked incident hypothesis with supporting evidence and known gaps.
Verification: Re-run supporting queries and confirm event ordering, affected operations, and component boundaries.
How to reconstruct a transaction
- Obtain an
operation_Idfrom a trusted, appropriately handled row; use synthetic IDs only in documentation examples. - Confirm the workload and configured window include the event. There is no component/window selector; the first discovered component is used. For subscription scope, Explain does not preserve an explicit non-default connection ID.
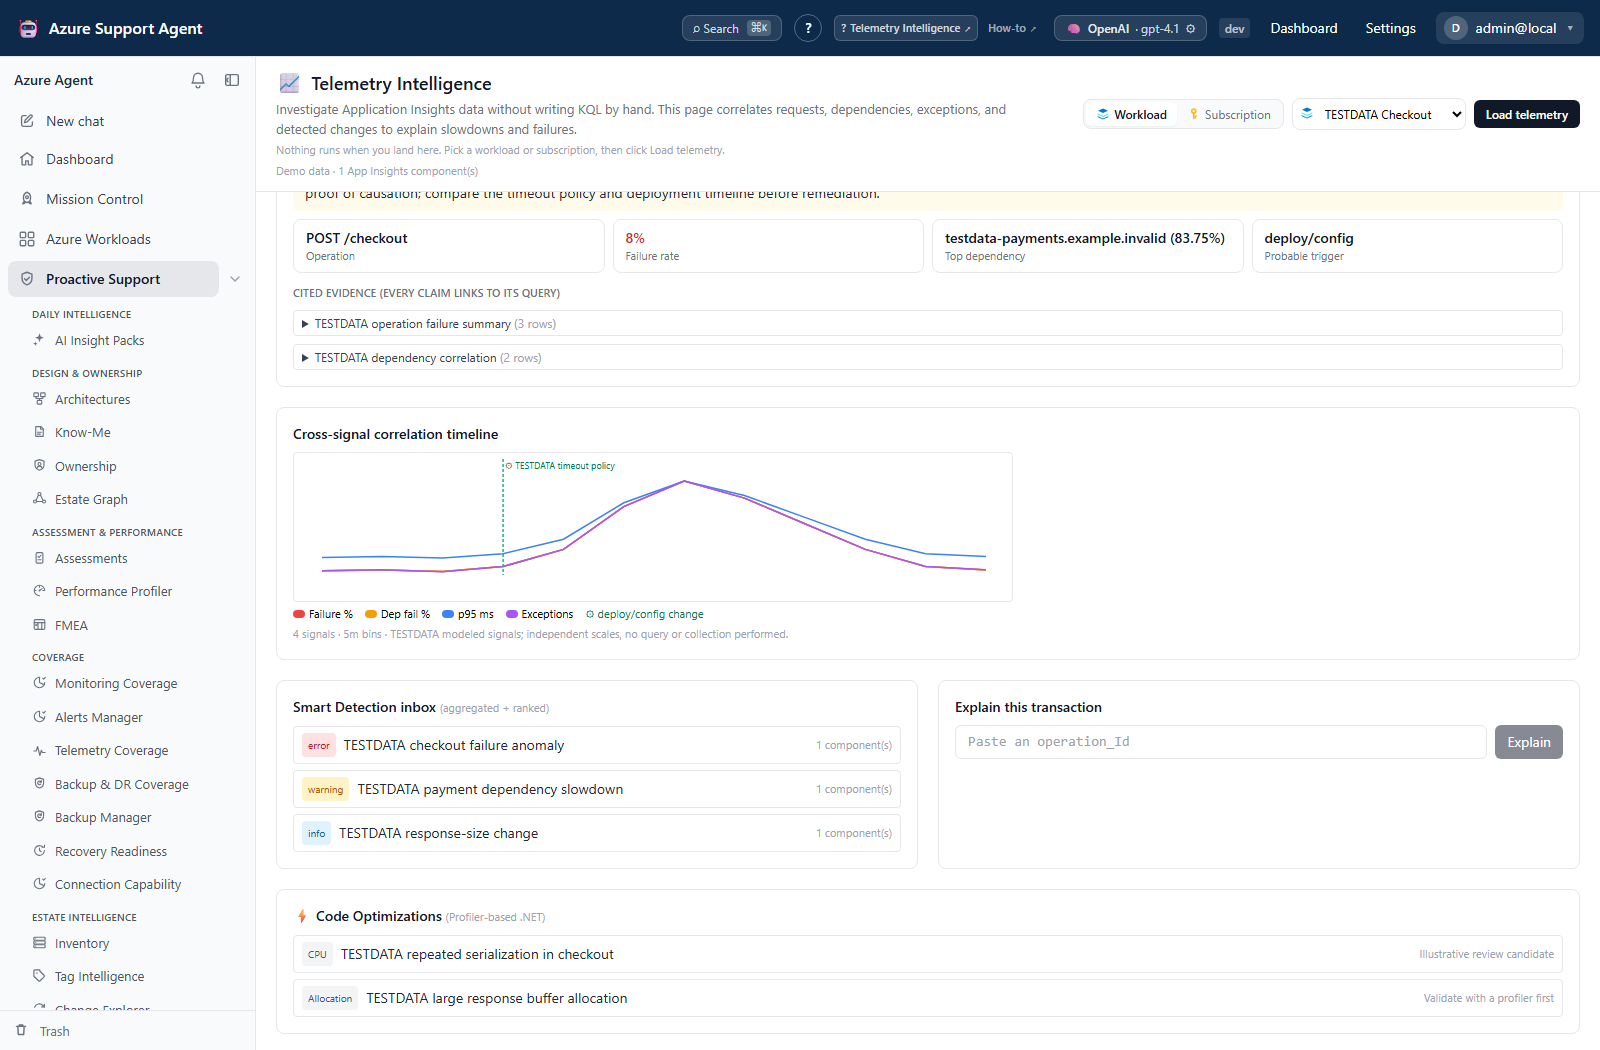
- Enter the ID under Explain this transaction and select Explain.
- Review span order, duration, result codes, dependencies, exceptions, and narration. The API carries parent IDs, but the UI shows an ordered list rather than a parent/child tree.
- If absent, check component, sampling, retention, ingestion delay, and ID in the source system. Results are capped at 500 spans; displayed total time sums request/dependency durations, not wall-clock latency.
Expected result: A bounded trace reconstruction for one operation where retained telemetry exists.
Verification: Compare reconstructed spans with raw requests/dependencies/traces and service logs.
How to preserve a finding or optimization proposal
-
Validate the KQL and raw evidence.
- Review code-optimization suggestions as proposals, not patches.
- Before any handoff, remove user/customer content, tokens, URLs with credentials, and unnecessary IDs from material you will share. Automatic ticket text has no editor here; if its hypothesis/queries are unsuitable, use an approved manual handoff instead.
- For a triage failure, select Create finding in workload scope, Open War Room for a prefilled composer, or Create ticket followed by an enabled Jira/ServiceNow connector. Finding and ticket endpoints both use
teleintel.read; picker loading additionally needsconnectors.manage. Ticket selection sends immediately without a separate approval. There is no pin or snapshot-attachment control on this page. - Re-query after remediation and add verification to the case.
Expected result: A traceable, minimally disclosed investigation record.
Verification: Destination scope and links are correct, and fresh telemetry demonstrates the intended outcome.
How to recover from an interrupted query without losing context
- Inspect any error and retain received KQL/rows as partial evidence, not a completed answer. Ask state and transaction results are page-local; no retained query-history/export or stream-resume control exists.
- Correct source permissions, CLI execution policy, query predicates, or AI-provider availability as indicated. Resubmit only after understanding the cause; a new question replaces the previous Ask display.
- Record approved query text, source time, and conclusions in the case timeline or an approved evidence artifact. Evidence Locker capture is separate, and its metrics option does not capture the Ask result table.
- After a failed/uncertain ticket or finding request, inspect the destination before repeating it. Repeated registration creates new runs and repeated ticket creation can duplicate external work.
Expected result: A controlled new query or verified handoff, not an invented retry/undo of prior work.
Verification: Confirm the relevant source rows and destination record. Reopening the page restores scope preferences, not the previous question, answer, transaction, or stream progress.
Safety and rollback
The query path is intended for read-only KQL and uses heuristic operator/table validation, not a substitute for least-privilege telemetry access or explicit bounded queries. Telemetry may contain personal or customer data. Do not paste secrets or raw payloads into AI prompts/tickets. Queries do not need Azure rollback; findings and tickets are application/external writes. Code/config changes based on suggestions require normal review, tests, deployment, and rollback outside the feature.
Freshness and partial results
Query execution reads the source rather than a retained telemetry snapshot, but activated overview/triage sections use client query caching and can refetch. Repeated Load telemetry is not a force-refresh control. Azure ingestion delay, sampling, retention, component boundaries, permissions, display caps, and timeouts can produce partial results. AI can misinterpret rows. An empty Smart Detection inbox is not proof of no incident.
Troubleshooting
| Symptom | Cause and resolution |
|---|---|
| No components | Verify scope, component existence, connection, and read permission. |
| KQL is rejected | Remove unsupported/control statements and reduce scope/limits. |
| Query times out | Narrow operation/time predicates and a final result limit; page-level component/timespan controls are not available. Check the reported source or provider error. |
| Transaction is absent | Check the first discovered component, default-connection fallback, operation_Id, sampling, ingestion, and retention. An empty result may render no card. |
| Narrative contradicts rows | Trust validated source rows, revise query, and disregard unsupported narrative. |