Grafana
Type: grafana Mode: token
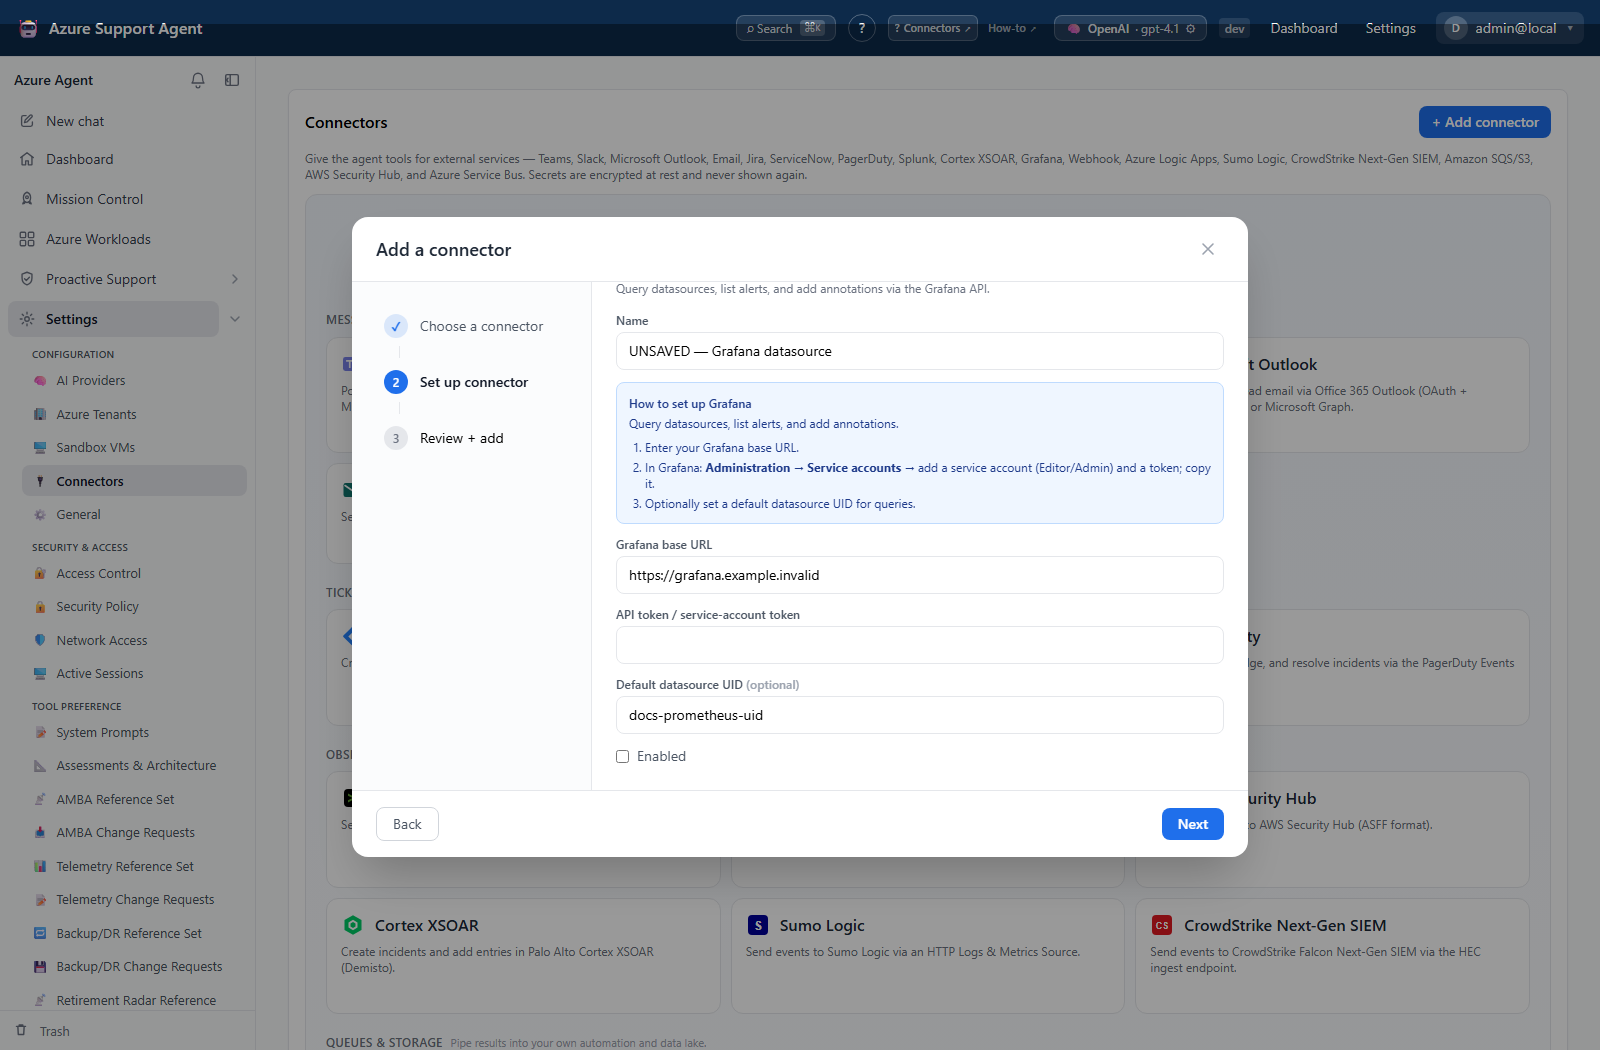
Configure Grafana base URL, API/service-account token, and optional default datasource UID. The health test calls Grafana’s health endpoint.
Implemented tools:
- list current Prometheus-style alerts and summarize firing state;
- run an instant datasource query for the configured/referenced datasource;
- create an annotation with text, tags, and optional dashboard UID.
Use a service account with only datasource-query, alert-read, and annotation-write permissions needed by enabled tools. Annotation creation is an external write and may require approval. Queries are interpreted by the selected datasource (for example PromQL or LogQL); the connector does not translate every query language.
Troubleshooting
| Symptom | Resolution |
|---|---|
| Health fails | verify base URL, DNS/egress/TLS, reverse-proxy path, and token. |
| Query fails | confirm datasource UID, datasource language, service-account access, and bounded time range. |
| Annotation absent | verify dashboard UID/tags, annotation permission, and time filters. |