Dashboard
Route: /dashboard (the root route also opens the Dashboard)
Purpose
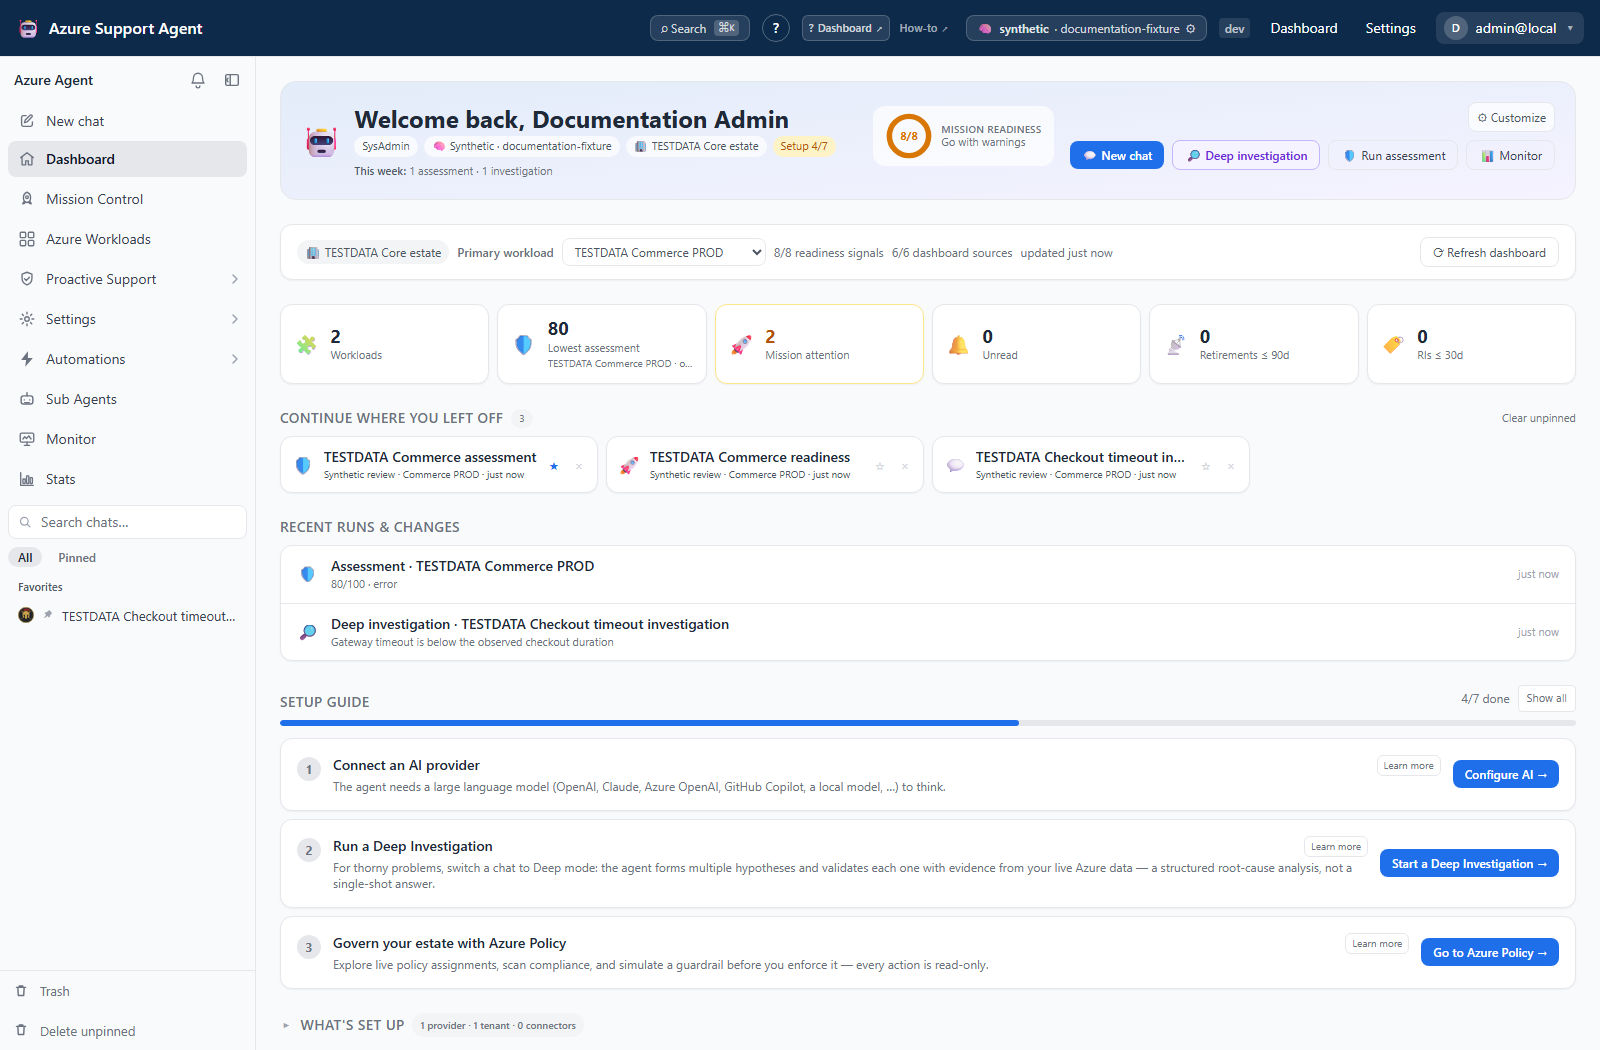
The Dashboard is the application’s home base. Use it after sign-in to finish setup, choose a primary workload, review Mission readiness and cached estate signals, resume recently visited work, and jump to the feature that owns the underlying detail.
When to use it
- Immediately after deployment to complete the setup guide.
- At the start of an operational review to scan readiness, source coverage, and recent activity.
- To compare monitoring, telemetry, backup/DR, and performance trends for one primary workload.
- To find the lowest assessment score, near-term retirement, reservation, identity, RBAC, or optimization signals available to your role.
- To resume an entity or scoped operational view from Recently visited.
The Dashboard is a summary, not a replacement for the source feature. Open the linked tool before making a decision.
Prerequisites and data sources
Prerequisites and permissions
A signed-in user needs at least one effective product permission to pass the NoAccess wall. Each Dashboard query, card, setup action, and shortcut is then filtered by its own capability instead of by an administrator role name. For example, provider configuration uses settings.read/settings.write, Monitor uses monitor.view, and workload, assessment, coverage, radar, reservation, identity, IAM, inventory, notification, task, connector, and agent cards use their owning permissions.
For a useful Dashboard, configure:
- An active AI provider.
- At least one Azure connection.
- A workload for scope-specific trends.
- Feature scans whose cached results feed the posture cards.
Tabs and actions
- Setup items, quick links, capability links, posture panels, and data queries appear only when the active role has their owning capability. A hidden card is not an authorization bypass; direct routes and backend endpoints check the same capability independently.
- New chat and Deep investigation appear only with
chat.use. - The header Search control or Ctrl + K/⌘ + K opens the command palette. It filters route destinations by the active permission set and only navigates; selecting an action-like label does not run that action.
- Selecting an available setup/posture card opens the owning feature. Running, saving, testing, approving, or applying then requires that feature’s operation capability.
- Recently visited records durable entities and scoped operational views after they are opened. Use Open, Pin, Remove, or Clear unpinned to manage the list. The command palette also offers accessible recent destinations.
Freshness and scope behavior
Dashboard queries are independent and non-blocking. Optional failures hide or degrade only the affected tile, while the source-coverage summary identifies available, unavailable, and still loading sources. Several posture reads use stored snapshots or trends and a five-minute client stale window; opening Dashboard does not trigger their Azure collection. Lower sections defer their secondary reads briefly, and collapsed sections do not load their owned data. The primary workload is stored in the browser and scopes the readiness, coverage, and performance lenses. Notification count, tasks, and recent-investigation/insight data use their own shorter client cache intervals. Refresh invalidates Dashboard-owned summaries only, not every application query.
Recently visited history is stored server-side per tenant and signed-in user. Destinations are allowlisted by type, rechecked against the user’s current permission on both write and read, and limited to 50 records for 90 days. Pinned destinations sort first but do not make storage unbounded. Deleted, archived, inaccessible, and no-longer-permitted database entities are not returned. Navigation history is a convenience feature, not a security audit record.
Workflow overview
Workflow
- Open
/dashboard. - Complete the outstanding Setup guide items. Expand the completed-items disclosure only when needed. A check indicates the configuration was detected; it does not certify every downstream permission.
- Select a primary workload when the coverage controls are available. The selection is retained in the browser.
- Review Mission readiness and its done, total, and attention counts. Treat Not assessed or unavailable sources as unknown, never clean.
- Check the context, freshness, and source-coverage bar before interpreting the actionable KPI strip.
- Use Recently visited to continue prior work, then review coverage trends, posture, risks, recent runs, scheduled activity, and notifications.
- Open the owning feature, refresh stale data if appropriate, and record the investigation or remediation there.
Interpretation of results
Interpret the Dashboard
- Setup complete means required configuration objects exist. Always test provider and connection health separately.
- Mission readiness uses the Mission Control rollup for the selected workload. Go, Warn, No-go, and Unknown retain that feature’s meaning; the Dashboard does not blend whatever optional scores happened to load.
- Source coverage describes whether Dashboard summary sources responded. It is not Azure monitoring coverage and is not a health score.
- Trend values are cache/history reads. They do not trigger a new Azure scan on Dashboard load.
- Missing or hidden cards may indicate no permission, a failed optional query, no primary workload, or no prior scan. Missing is not equivalent to healthy or zero.
- Assessment averages summarize completed runs and can hide a low-scoring workload; inspect the lowest run.
- Freshness matters. Follow a tile into its feature to see scan age and scope.
- Recent runs, changes, and visited items are navigation cues, not a complete audit log.
Exports, history, scheduling, and integrations
The Dashboard exposes server-backed recently visited history and links to feature-owned exports, schedules, and integrations. It does not create a separate compliance history or export of its own. Use the Audit Log and the owning feature’s durable records when evidence retention matters.
Safety and limitations
Safety
The Dashboard itself is read-oriented. Its links can lead to scan, generation, or mutation workflows with different permissions. Before acting:
- Confirm the selected workload and Azure connection.
- Refresh stale evidence in the owning feature.
- Distinguish unknown/not analyzed from zero coverage.
- Review generated remediation and approval prompts.
- Use the Audit Log or durable feature history when a compliance record is required.
Troubleshooting
| Symptom | Resolution |
|---|---|
| Setup item remains incomplete | Test and activate the provider/connection, then reload; non-admin views may expose only a summary |
| Coverage cards are empty | Create/select a workload and run the corresponding scans |
| A panel disappeared | Check the active role’s exact capability, endpoint access, and whether the optional data source failed |
| Values look old | Open the owning feature, check freshness, and run a scoped refresh if authorized |
| Dashboard is slow | Expensive panels are deferred and cached; check failing network requests rather than repeatedly refreshing |
| Primary workload is wrong | Change the workload selector; the choice is stored per browser |
| A recent destination is missing | Stay on the destination briefly, then check its permission and whether the entity was deleted, archived, or older than 90 days |
| A source shows unavailable | Open the owning feature and inspect its request, permission, scope, and last successful collection; do not interpret unavailable as healthy |