Run Performance Profiler
Screenshot context: These native application examples use isolated synthetic demo data, not live Azure evidence or measured production performance. Demo Azure writes are disabled. Use the live verification steps below before treating a metric, score or headroom estimate as capacity evidence.
Prerequisites
perfprofile.readand an enabled connection that can read Resource Graph and Azure Monitor metrics.- A current workload definition for workload mode, or a subscription and connection for subscription mode.
settings.readandsettings.writeonly when changing profiler capacity under/admin/settings; the route is read-gated and saving is write-gated.- Optional: an AI provider for narrative, Jira or ServiceNow for tickets, and Evidence Locker storage for evidence capture.
Route
Open /performance. Its top-level views are 🔥 Profiler, 🚀 Fleet, and 🧹 Cleanup. Capacity controls are under /admin/settings.
How to profile one workload or subscription
- Open Profiler and select workload or subscription scope.
- Confirm the Azure connection. A workload uses its own connection unless an explicit connection is selected.
- Choose an exact start and end. Use a short window for a spike and a longer window for recurring saturation, but keep later comparisons on the same window and interval.
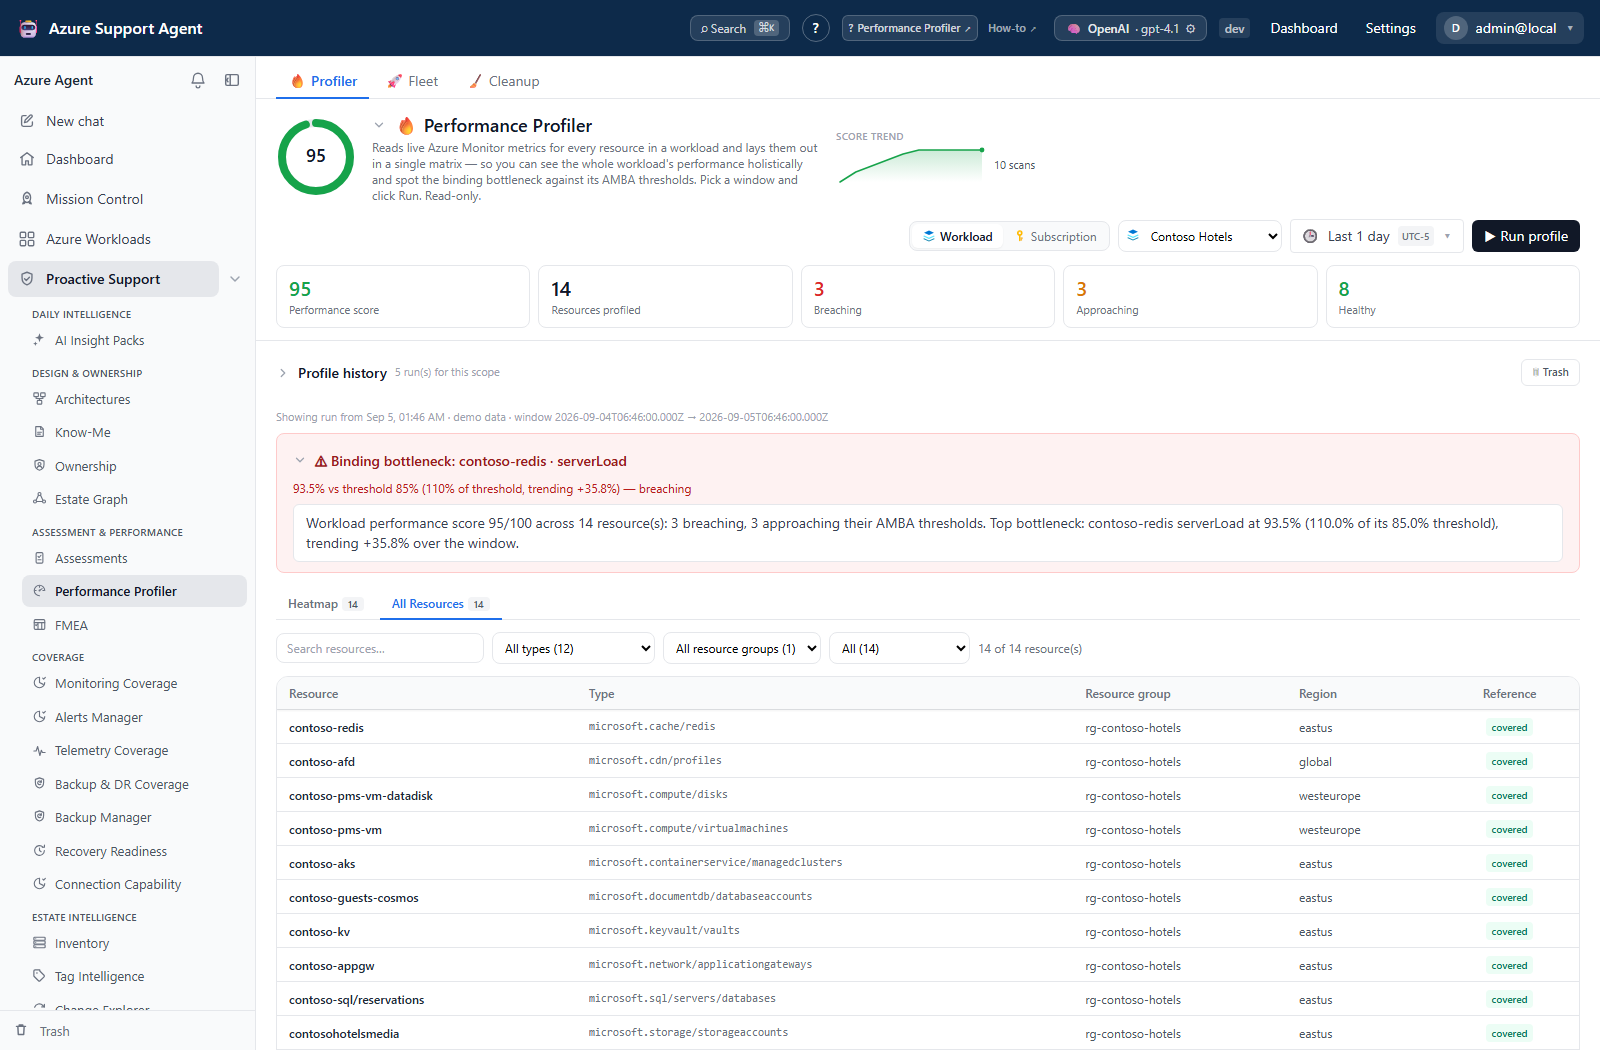
- Select Run profile. The focused screen streams each completed resource and can continue while navigating in the same browser tab.
- Wait for
succeeded,partial, orfailedin Profile history. Open the row when it is not already displayed. - Confirm discovered, eligible, selected, and completed resource counts before using the score.
Expected result: One attempt is retained with an exact time range, collection status, completeness counters, resource metrics, scorecard, and optional narrative.
Verification: Match the scope, connection, start/end, status, completeness percentage, scan-cap flag, and a sample metric in Azure Monitor. Use the coarser of the configured interval and that AMBA alert’s window_size when comparing buckets.
How to recover an interrupted focused stream
- Read the stream error. A premature disconnect clears the browser’s running indicator and refreshes history/Fleet; it does not establish the server task’s final status.
- Reopen
/performancewith the same workload or subscription and inspect Profile history for the same time window. The server task may still be collecting and can save its attempt after the browser disconnects. - Open the saved attempt when available and inspect its status, completeness, and errors. A saved failed attempt is diagnostic history, not a successful profile.
- Do not immediately duplicate the scan because browser progress stopped. If the server restarted, do not expect focused-run replay or automatic resumption; use Fleet for durable queue tracking and restart recovery.
Expected result: An interrupted browser stream is reported rather than remaining indefinitely marked running, and any completed server attempt is discoverable in history.
Verification: Match the saved attempt’s scope and time window and inspect its terminal status before retrying or using its score.
How to analyze the heatmap and all resources
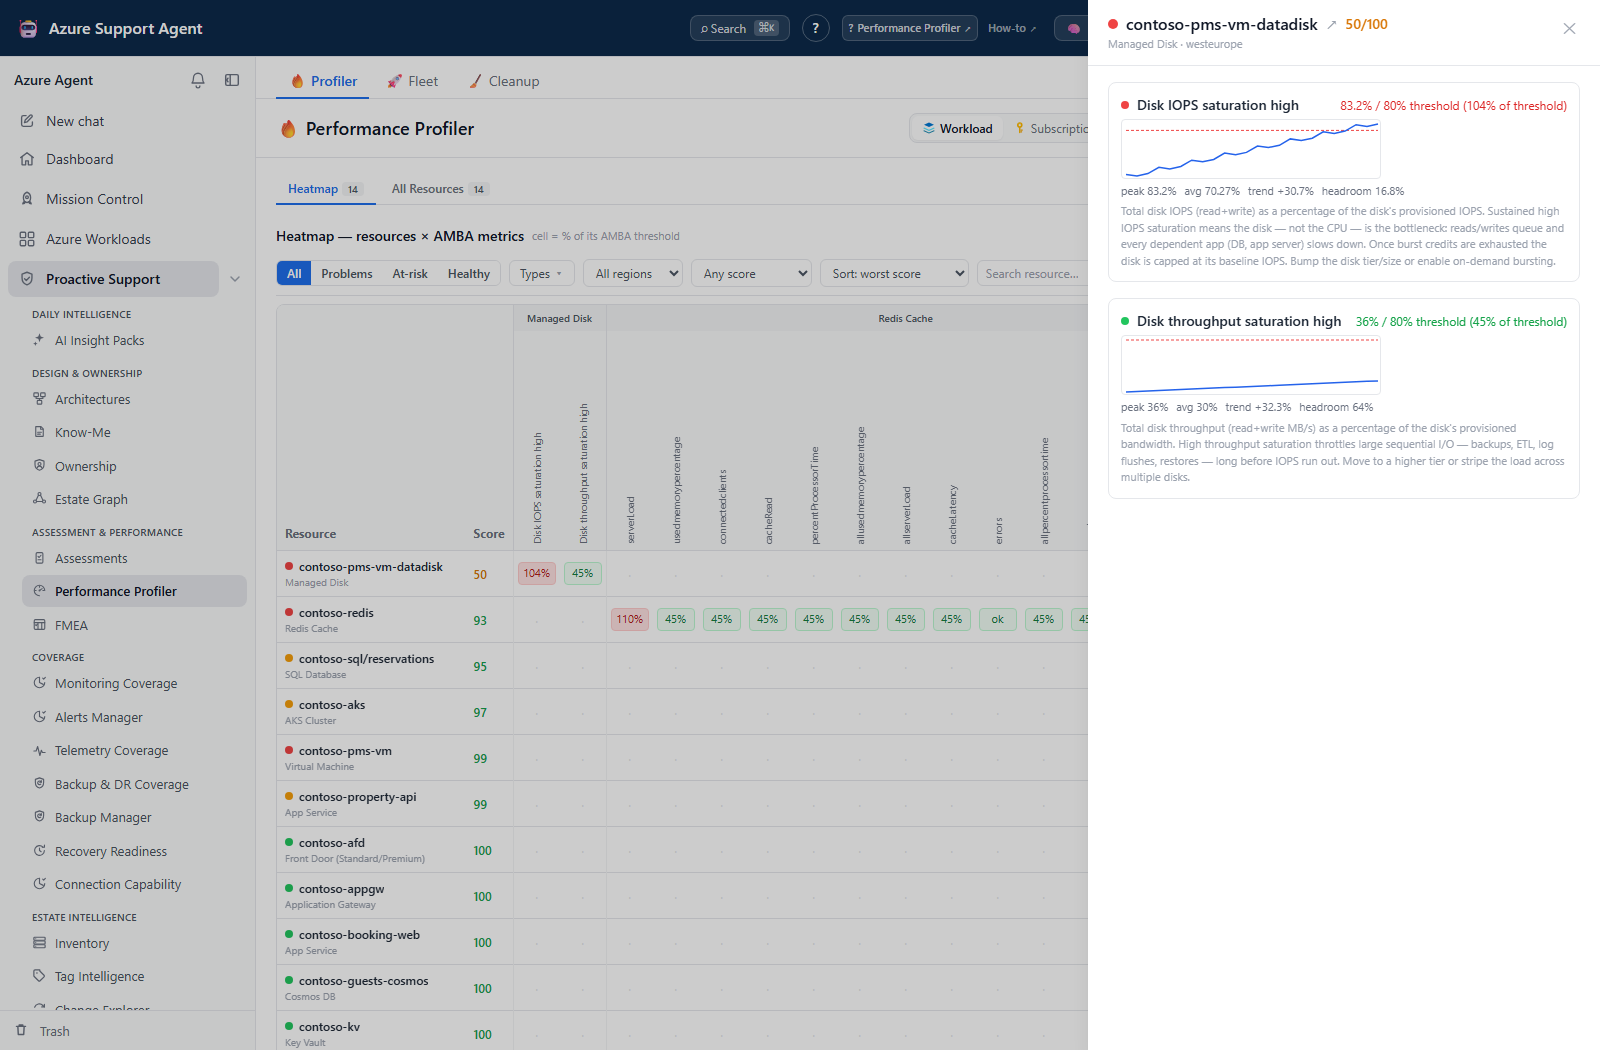
- Open Heatmap and start with highest bottleneck scores and red/amber cells.
- Inspect metric value, threshold/baseline, resource, type, region, and available trend/detail.
- Filter resource types or choose a resource to narrow the matrix.
- Open All Resources for the full searchable/filterable virtualized resource list.
- Correlate with deployments, scaling, logs, dependencies, and user-impact telemetry.
- Treat green as “did not cross this baseline,” not proof of service health.
Expected result: A small set of candidate bottlenecks is supported by metric observations.
Verification: Reproduce important values in Azure Monitor for the same resource, aggregation, and time window.
How to use narrative, findings, tickets, evidence, and PDF
- Read the AI narrative as a hypothesis and compare every claim with the matrix.
- Select 🛡️ Register findings to create Performance-pillar findings from current bottlenecks.
- For a specific bottleneck, choose 🎫 Ticket and the intended connector.
- Select 🗄 Evidence to capture the currently viewed run as an immutable Evidence Locker snapshot.
- Select 📄 PDF for the current or historical run; wait for generation or cancel the request.
- Open Assessments/Evidence/external ticket and confirm the handoff.
Expected result: Validated bottlenecks have traceable findings, ticket/evidence records, or a report.
Verification: Match scope, run ID/time, resource, metric, threshold, and window in each handoff.
How to operate a durable Fleet batch
- Open 🚀 Fleet and review the trusted successful score plus newest-attempt status for each workload.
- Filter or sort the grid, select a bounded workload set, and choose one shared time range. The API accepts at most 500 workload IDs and removes duplicate IDs.
- Select Run profiler on selected once. The server returns a SQL-backed batch immediately and the page polls it while queued or running.
- It is safe to navigate away, close or reload the browser, or restart the server. On startup, an interrupted running item is re-queued; terminal items remain complete.
- Interpret item states separately:
succeeded,partial,failed, andcancelledare terminal. A mixed batch becomespartial. - Open individual workloads after the batch finishes and validate their completeness and exact window.
Expected result: Every selected workload reaches a terminal item state without depending on the browser process.
Verification: Reopen /performance, select Fleet, and confirm the same batch ID, completed/total counts, per-state counts, item run IDs, and time range.
How to cancel or retry Fleet work
- Select Cancel pending only when queued work should not start.
- Expect queued items to become
cancelled. The currently running workload continues safely under normal operation. - Wait for the batch to reach a terminal state.
- Inspect failed or partial item collection counters and bounded error details before retrying.
- Select Retry failed/partial. The backend retry includes failed, partial, and cancelled items and preserves the original batch time range.
- If the UI creates a fresh selection batch instead, verify its displayed time range before submitting.
Expected result: No new queued workload starts after cancellation, and retry creates one new idempotent durable batch for retryable items.
Verification: Confirm the original batch is terminal, the retry has a different batch ID, and successful items from the original batch were not re-run.
How to interpret completeness and unknown scores
- Read
statusandcompleteness_pctbefore reading score. - Treat
metric_checks_no_dataas a completed request with no observations, not as healthy. - Treat
metric_checks_failedas unevaluated. Open the error details to distinguish throttling, timeout, access, and transport failures. - If the scan cap was reached, treat the attempt as partial even when every selected resource completed.
- Use a score only when it comes from observed metric cells. A blank resource or workload score is unknown; never substitute
100. - When the newest attempt is partial or failed, compare it with the latest successful run without assuming the older score is current.
Expected result: Decisions distinguish observed health, valid no-data, failed collection, and scope truncation.
Verification: Confirm that partial or failed attempts appear in history while Fleet score, cache-derived views, and trend remain on the latest complete success.
How to verify storage-service and coarse-grain metrics
- Open the completed profile and select a storage-account capacity or count cell that is expected to have observations.
- Identify the metric’s AMBA
metric_namespaceandwindow_size. Service-level namespaces targetblobServices/default,queueServices/default,fileServices/default, ortableServices/default; an account-level namespace targets the storage account itself. - Compare the cell with Azure Monitor on that exact target resource, aggregation, and profile time range.
- Use the coarser of the configured profiler interval and the alert’s
window_size. For example, aPT1Hcapacity/count reference is queried hourly even when the profiler default isPT15M. - If the profile reports
BadRequestor no data while Azure Monitor has observations, ask an administrator withcoverage.manageto inspect the active AMBA entry. Do not replace a service namespace with the parent storage-account namespace or force a finer unsupported interval. - Run a new bounded profile after the reference is corrected; historical attempts retain their original result.
Expected result: Each storage metric is read from its Azure Monitor service subresource at a supported aggregation grain, while account-level metrics remain on the parent account.
Verification: Match the metric target, namespace, aggregation, effective interval, and one observed value between the profile and Azure Monitor.
How to tune profiler capacity safely
- Open
/admin/settingswithsettings.readandsettings.write, then record all five Performance Profiler capacity values. - Keep Fleet workloads in parallel at
1unless measurements justify2or3. - Use Delay between Fleet starts to spread authentication and discovery; the default is 1,000 ms.
- Keep Azure Monitor calls in parallel low because the gate is process-wide across Fleet, focused runs, Mission Control, and agent tools. The default is
2. - Set Metric request attempts as total attempts including the first. The default is
3; the accepted range is 1–6. - Set Workload timeout to a bounded collection ceiling. The default is 1,200 seconds; the accepted range is 60–7,200.
- Save. Start delay, metric concurrency, attempts, and timeout apply to subsequent work. If Fleet workload concurrency changed, restart the application so the worker pool is recreated; durable SQL work resumes after startup.
- Run a small Fleet batch and inspect throttled, retried, timed-out, failed-check, and duration counters before increasing capacity again.
Expected result: The bounded test finishes without an unacceptable increase in throttling, partial attempts, Azure CLI processes, or host load.
Verification: Reload /admin/settings, review /admin/audit for settings.update, restart when worker width changed, and confirm recovered batch progress plus observed concurrency.
How to recover after a browser or server restart
- Reopen
/performanceand select Fleet. The latest batch endpoint restores the current SQL state without the original browser. - If the server restarted, expect an interrupted item to return to
queued, thenrunning. - If no item advances, verify the
0007_perf_profile_fleetdatabase migration and Fleet worker startup before resubmitting. - Do not create a replacement batch until the durable batch is confirmed missing or terminal.
- After completion, open each recovered item’s run and confirm there is only one attempt for its item trigger.
Expected result: Queued work resumes, terminal work remains intact, and no duplicate successful history record is created for a recovered item.
Verification: Compare batch and item IDs before and after restart and confirm completed/total counters converge to a terminal batch status.
How to use history and cleanup
- Use Profile history to select comparable runs and download a run-specific PDF.
- Move obsolete runs to Trash first; restore if required.
- Open 🧹 Cleanup for bulk retention review.
- Purge individual or all trashed runs only after evidence/report retention is satisfied.
Expected result: Useful history remains available and obsolete data follows recoverable-then-permanent deletion.
Verification: Restored runs reopen; purged runs do not; evidence snapshots remain separate records.
Safety and rollback
- Profiling reads Azure. Finding registration and Evidence create application artifacts; Ticket sends an external event.
- Default Fleet workload concurrency is
1, process-wide metric concurrency is2, and the deployment assumes one application replica. Do not treat a process-local limit as a distributed quota. - Compatible metrics share a request and one service-principal session is reused per profile. Repeated authentication or one request per metric indicates an operational regression.
- Storage service namespaces are routed automatically and a coarser AMBA
window_sizeautomatically widens that check’s interval. These are read-path compatibility adjustments; they do not modify Azure alerts or the selected profile range. - Transient
429and5xxresponses are retried andRetry-Afteris honored. Retry exhaustion is surfaced as failed or partial, never green. - Roll back capacity by restoring recorded values, restarting if Fleet worker width changed, and repeating the same bounded batch.
- Trash is rollback for run deletion. Purge cannot be undone.
Troubleshooting
| Symptom | Resolution |
|---|---|
| Fleet batch stays queued after deployment | Apply migration 0007_perf_profile_fleet, confirm database availability, and confirm the Fleet worker started. Restarting is safe because queued and running rows are recovered. |
| Browser reload loses focused-run progress, or the stream disconnects before completion | Focused progress is browser-memory state. Stream errors clear the local running indicator and refresh history/Fleet, while the server task may continue. Reopen history for the same scope/window before retrying; use Fleet for restart-durable execution. |
| Cancel appears incomplete | Cancel pending stops queued items only. Wait for the claimed workload to finish and for aggregate counts to become terminal. |
Many items become partial with 429 or 5xx errors | Lower metric concurrency, increase Fleet start delay, and let the reported Retry-After expire before retrying. Check retry and throttle counters rather than blindly increasing attempts. |
| Workload times out | Narrow scope or window, validate service-principal login and Azure Monitor access, inspect the last resource/error, then adjust the bounded timeout only with evidence. |
| Score is blank with 100% completeness | All checks completed as no-data. Confirm metric support, provider delay, interval, and window; the posture is unknown. |
Storage capacity/count check returns no data or BadRequest | Verify the AMBA metric_namespace, the corresponding service /default target, and the reference window_size. Compare at the effective coarser interval rather than forcing the global 15-minute default. |
| A partial retry did not change the visible Fleet score | Only a complete success replaces the trusted score, cache, and trend. Open the attempt overlay and history to verify the retry result. |
| Saved Fleet concurrency is not active | Restart the application; worker task count is created at startup. Other profiler capacity controls are read during subsequent work. |