Quota Monitor
Permissions: quota.read; quota.run to scan
Purpose
App route: /quota Quota Monitor uses modular collectors for compute, network, storage, App Service, SQL, Key Vault, Monitor, AI, governance, and throttling signals. Results are subscription-scoped and cached; scans are manual rather than scheduled.
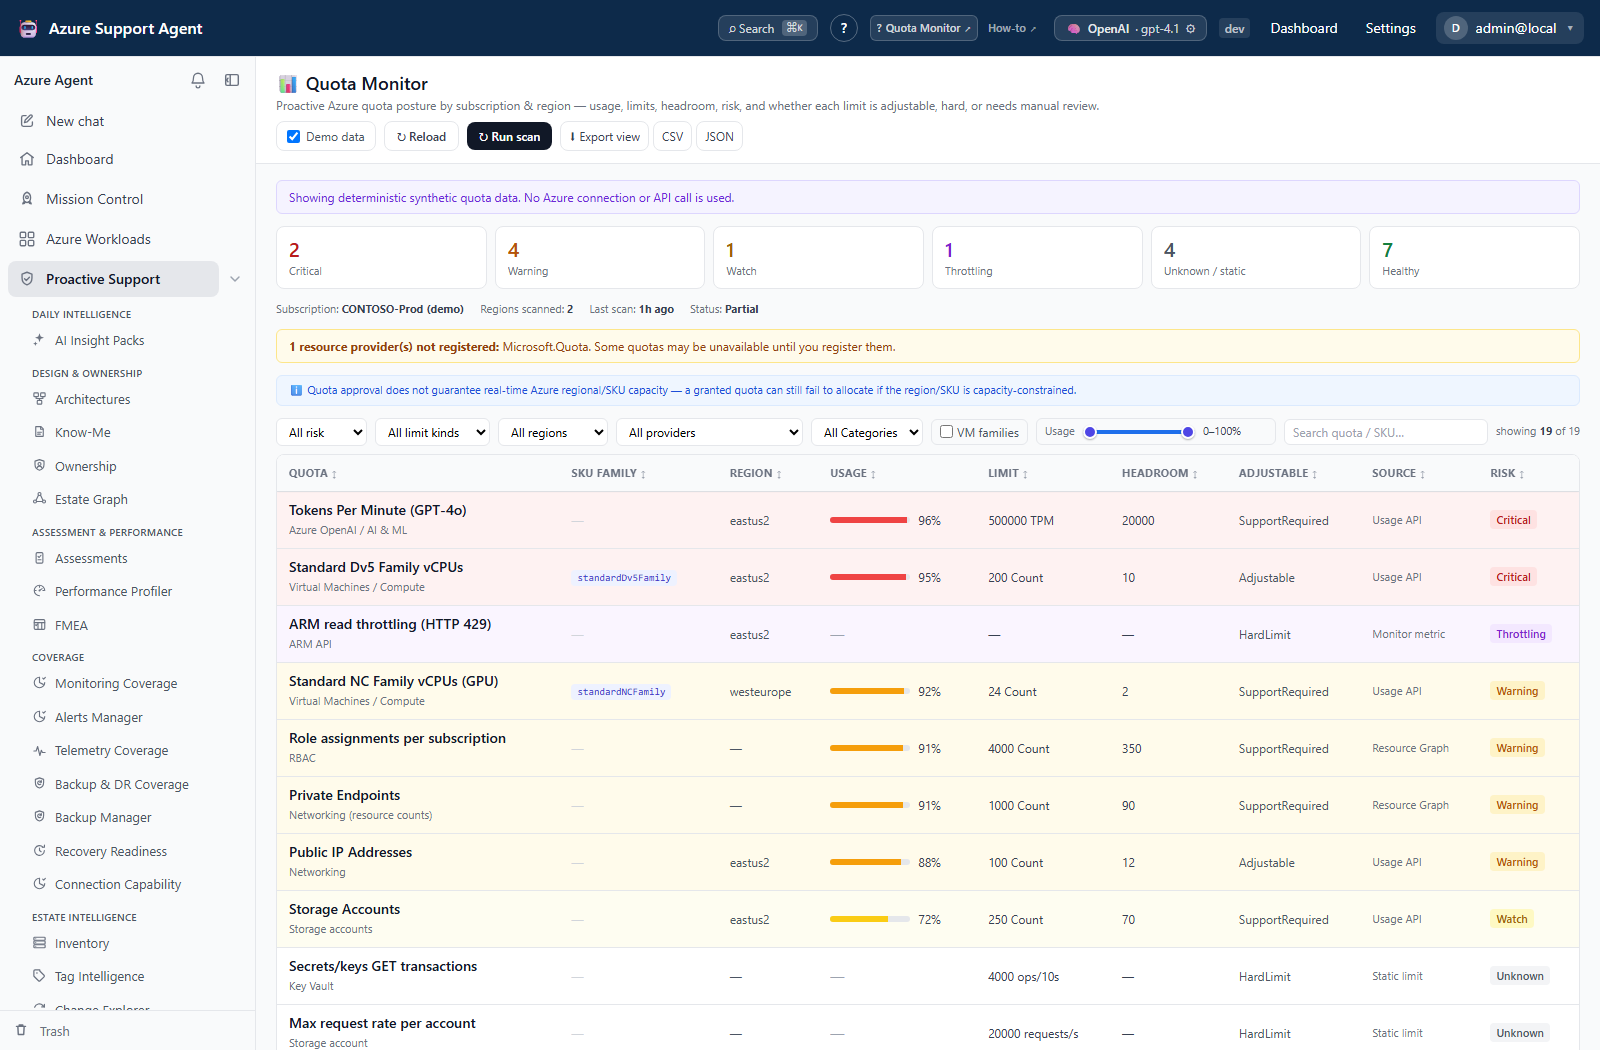
Screenshot context: This native application view uses the built-in Demo data mode with synthetic quota rows, not a live subscription scan or Azure capacity evidence. Demo Azure writes are disabled. Example limits and headroom are not current quotas or a guarantee of available regional capacity.
Prerequisites and data sources
- Select an Azure connection and subscription readable by the relevant quota, usage, Resource Graph, and Monitor APIs.
- Register required resource providers for the categories being scanned.
- Obtain
quota.runfor a fresh scan; read permission alone can view saved results. - The UI subscription tree additionally requires
workloads.read; it is separate from Quota’s own read endpoints. - For an offline walkthrough, enable Demo data. The deterministic demo uses no Azure connection or API call.
How to load saved results or collect a bounded scan
- Choose a subscription, or enable Demo data for the synthetic offline path.
- Select Load to read the latest cached quota snapshot, then review risk distribution, generated time, and provider registration states. Reload reads that cache again; it is not a new quota collection. Opening the subscription or region picker can make separate discovery calls.
- Select bounded regions and categories, set Show unused to include zero-usage rows when needed, then select Run scan with
quota.run. - Follow streamed collector progress; partial failures should be interpreted separately.
- Filter the loaded table by region, category, provider, risk, limit kind, VM families, usage range, or text. Scan-scope selectors at the top affect the next collection; table filters do not rescan Azure.
- Prioritize rows by usage percentage and remaining headroom, then follow the displayed recommendation.
- Export CSV or JSON for capacity planning.
Expected result: A cached subscription snapshot with streamed collection progress and per-row source, collection status, recommendation, and risk.
Verification: Confirm subscription, regions scanned, Status, and Last scan before using a result. Opening or switching scope does not automatically run a scan. The cache retains one latest snapshot per application tenant/subscription, not separate snapshots per connection, region selection, or category selection; a narrower scan replaces that subscription’s previous snapshot.
Default bands are Watch at 70%, Warning at 85%, and Critical at 95%. Read the saved snapshot’s thresholds in the full JSON export for the values used by that scan. These settings exist in the backend, but the current settings update schema does not expose quota tuning; do not assume a General settings control can save them. The default freshness interval is six hours; staleness prompts a rescan rather than expiring or refreshing stored results automatically.
How to interpret a row before requesting capacity
- Open a row to inspect quota/SKU family, region, usage, limit, headroom, source, Collection, Checked, errors, and Recommendation. Expand Raw provider response for supporting detail; it can be redacted or abbreviated.
- Distinguish
Adjustable,HardLimit,SupportRequired, andUnknownadjustment paths. AManualReviewRequiredorNotSupportedsource/status is not a healthy result. - Treat
Unknownas unresolved unless its recommendation explicitly explains a by-design singleton or remaining-allowance counter. A Network Watcher at its singleton limit, for example, is not automatically a capacity emergency. - Treat Throttling as observed ARM HTTP 429 pressure, separate from regional quota capacity. Confirm raw usage and limit: displayed percent is capped at 100% and remaining headroom is floored at zero.
- Use Request increase (Portal) to open Azure’s Quotas blade, or Copy az quota show/Copy scope for an external review. These controls do not submit an increase or execute the copied command. Validate the provider-specific resource name before using copied text.
Expected result: A source-checked capacity action rather than an automatic Azure change.
Verification: Match subscription, region, quota family, and units in Azure. Quota approval does not guarantee real-time regional/SKU capacity. Scans do not register providers, apply changes, or supply an approval/rollback workflow.
How to export results and interpret history or a failed scan
- Select Export view for a CSV of the current filtered/sorted table. Use the separate CSV or JSON links for the full latest cached snapshot, independent of display filters; JSON also preserves thresholds and collector metadata.
- Review At-risk trend when at least two history points exist. The page requests the latest 20 scans; “new at risk”/“recovered” compares Warning/Critical quota keys, not a saved full-row diff or proof of remediation.
- Check Status even after a green scan-complete message. Collector failures produce error rows and
partial/failedstatus; a run can be recorded despite all collectors failing if no top-level error was set. Fix the reported source permission/provider problem, then manually rerun a bounded scope. - Use Minimise to leave the progress dialog while collection continues across in-app navigation. Cancel aborts the browser stream, not a durable server job with a verified cancel state. Reloading/closing the browser loses the in-memory progress registry; return and Load to establish whether a final snapshot was saved before starting another scan.
- Preserve exports before a new scan when historical row-level evidence matters. Completed error snapshots can replace the cache; there is no Radar-style last-good guarantee, retry-failed-only action, scan-history purge, or snapshot restore control in Quota Monitor.
Expected result: A correctly scoped export and a cautious recovery decision based on persisted results, not only a progress notification.
Verification: Compare the export’s row count and generated time with the intended view/full snapshot. A scope change or missing collector can remove a risk key from history without resolving the Azure problem. Scans are manual, read-only toward Azure, and can issue many API calls; keep scope narrow and allow automatic request backoff rather than repeatedly launching scans.
Troubleshooting
| Symptom | Cause and resolution |
|---|---|
| Provider is not registered | Register the named namespace through an approved Azure process, then rescan. |
| Throttling observed | Stop repeated scans, allow recovery, and retry with fewer regions/categories. |
| Category has no rows | Check collector support, permissions, provider state, and source/remediation hint. |
| Run scan is disabled or returns forbidden | A disabled button usually means no subscription or an active scan; a forbidden response means quota.run is missing. quota.read is still needed to enter the page and inspect/export results. |
| No rows after Load/export | No snapshot may exist, or table filters may hide the rows. Use Clear all, check never loaded, and run a scan only when needed. An empty full export does not launch a scan. |
| Values differ from Portal | Confirm subscription/region/SKU and refresh both sources; APIs can expose different quota families. |