Recovery Readiness
Product permissions: resiliency.read to view; resiliency.admin to set recovery objectives and tune the restore-rate reference.
Purpose
App routes: /resiliency and /resiliency/:tab
Every other view in this area answers a neighbouring question. Backup Manager answers is backup working. Backup & DR Coverage answers is it configured. Assessments answers does it meet best practice. FMEA answers what could fail and how bad.
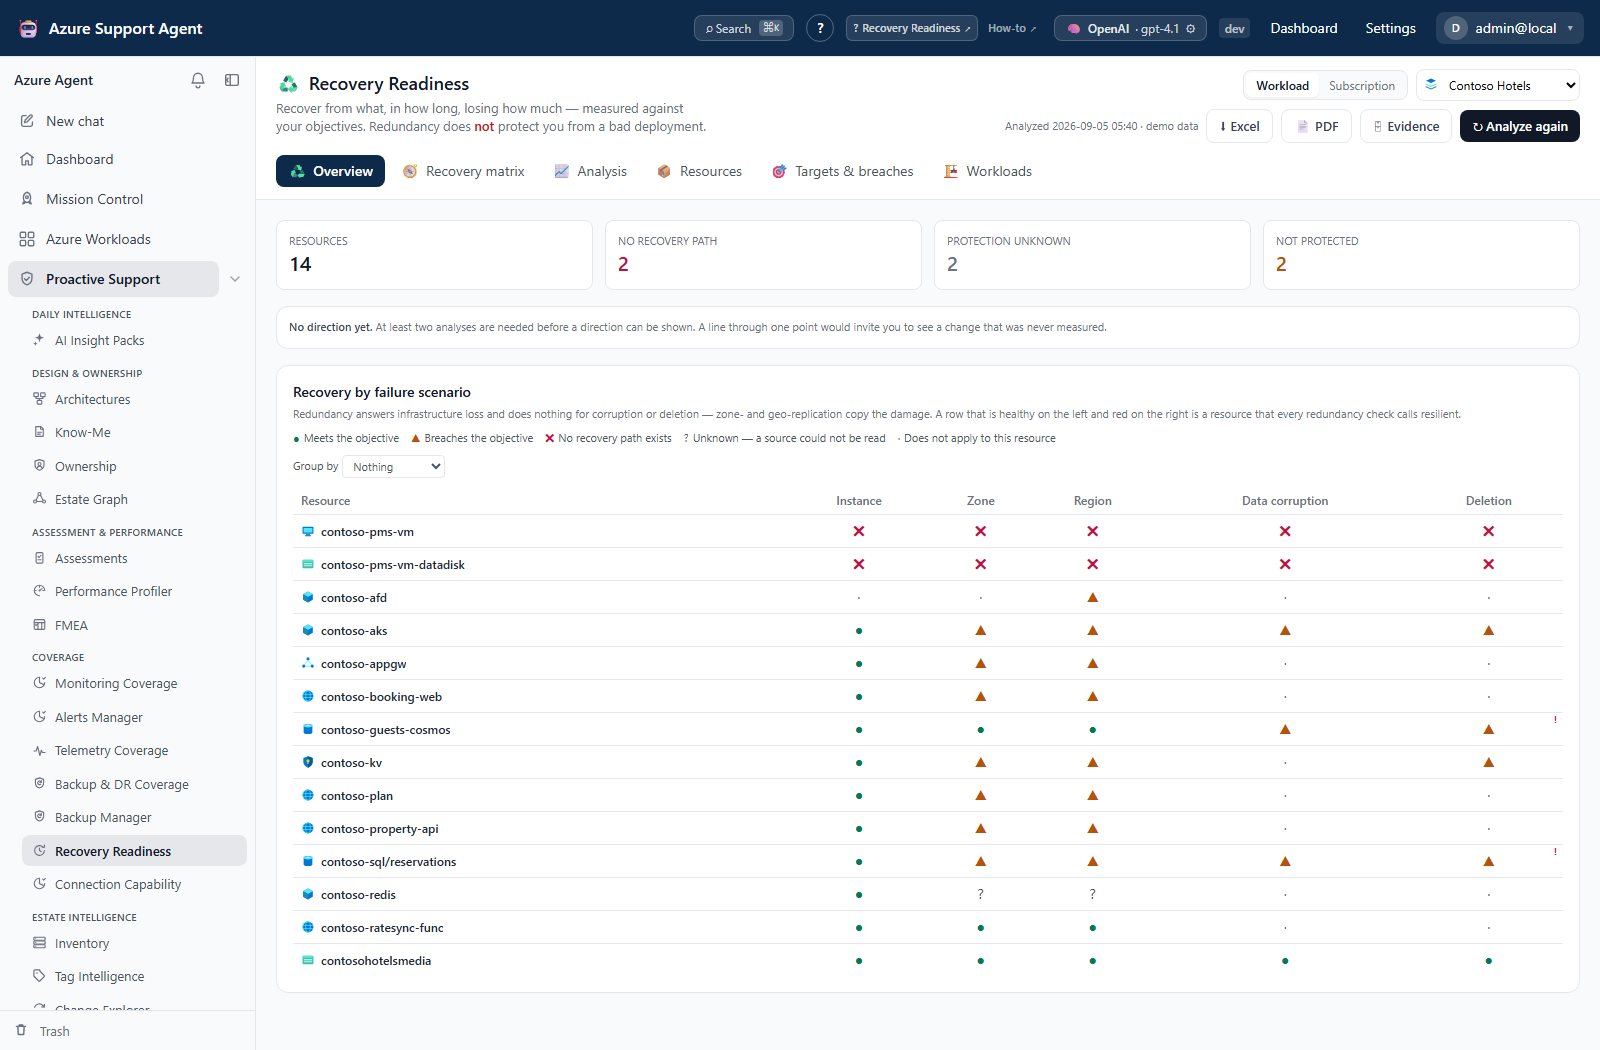
Recovery Readiness answers the one an application owner actually asks:
Recover from what, in how long, losing how much?
It is read-only and makes no changes to Azure.
Read-only here means no Azure mutation, not no application writes. Explicit analysis saves a snapshot and live-scope trend; objective/rate editing and acknowledgment change the reference; Evidence captures immutable application content. These actions do not use the managers’ Azure approval ledger.
Screenshot context: These native application views use isolated synthetic demo data, not live Azure evidence. Demo Azure writes are disabled. Recovery classes, RPO values and duration estimates illustrate the model, not measured recovery or a completed drill; unknown and no recovery path remain different outcomes.
Prerequisites and data sources
Live analysis needs a readable Azure connection and a workload or subscription in scope. Run Backup Manager analysis for that same scope to supply the protection join; without its snapshot, those protection facts are unknown, not evidence that the resources are unprotected.
A recognized catalog demo workload can be analyzed with no Azure connection selected and without a prior Backup Manager analysis. Its configuration, backup, replication, and lock facts are synthetic. resiliency.read is still required. Selecting a scope loads any saved report; Analyze recovery posture explicitly creates or refreshes the analysis, including for demos. Demo analyses do not contribute trend points.
For Recovery Readiness, an explicit connection is always validated, even for a demo: an unknown ID returns HTTP 404; a disabled connection or a mismatch with the workload’s saved connection returns HTTP 400. Omitting the connection is different from supplying an invalid one.
The UI offers workload and subscription scopes. The API also accepts a management group; that is not a third picker mode on this page. Configuration comes from the supported Resource Graph type catalog, supplemented by ARM blob-service settings and management locks, the saved Backup Manager protection/replication join, and Advisor recommendations. Workload configuration is narrowed to members and attached VM disks.
Collection is bounded: configuration retains at most 5,000 rows, blob-service reads cover at most 400 accounts, and Advisor queries request at most 2,000 rows. The snapshot store retains 24 scopes, up to 5,000 resource rows, 5,000 breach rows, and 500 workload rows. A resource type outside the collector catalog is not modeled by this scan; it can be absent rather than represented by an unknown row. Do not treat this catalog as all Azure services.
The idea you need before anything else on this screen makes sense
“RTO 4 hours” is not a fact. It is an answer to an unstated question — recover from what?
- A zone-redundant virtual machine survives a zone outage untouched, and is completely unrecoverable once somebody deletes its resource group.
- A storage account with geo-redundant storage has an excellent region story, and for ransomware it has a fifteen-minute head start on replicating the encryption to the paired region.
- A database with a nightly backup and no replica is fine after a corrupt migration, and gone after a region failure.
The same resource has different answers for each. So this module reports recovery per failure scenario, never as a single number.
The five scenarios
| Scenario | What fails | What actually saves you |
|---|---|---|
| Instance loss | one instance, node or replica | instance redundancy, platform self-healing |
| Zone loss | one availability zone | zone redundancy |
| Region loss | a whole Azure region | geo-replication, a paired region, Site Recovery |
| Data corruption | a bad deployment, a bad migration, ransomware | point-in-time recovery only |
| Accidental deletion | a resource or its data is deleted | backup or soft delete; a lock prevents but does not recover |
Redundancy is not a control for the last two
This is the single most important thing on the screen.
Zone-redundant storage, geo-redundant storage and multi-region writes replicate the damage, usually within seconds. A corrupted blob is corrupted in all three zones. A deleted row is deleted in every replica.
So a resource can be flawlessly redundant — green on every redundancy check, green in every other tool — and have no recovery path at all from a bad deployment. Recovery Readiness is the view that says so.
Deletion has a blast radius
The second most important thing on the screen, and it applies to accidental deletion only.
A backup only helps if it outlives the thing that was deleted. Corruption leaves the resource standing, so any point-in-time copy will do. Deletion does not, and how far the damage reaches decides whether the recovery path still exists:
| What was deleted | Azure SQL database | PostgreSQL / MySQL flexible server | Storage account |
|---|---|---|---|
| Rows or a table | Point-in-time restore | Point-in-time restore | Blob soft delete |
| The container / database | Restore the deleted database | Point-in-time restore | Container soft delete |
| The parent server / the account | Unrecoverable without long-term retention | Five days, management API only | 14 days, best effort |
The bottom row assumes the resource’s own built-in backup is all you have. A Backup vault changes it, because vaulted backups are stored outside the resource: vaulted blob backup survives deletion of the storage account (restoring to a different account), and a vaulted PostgreSQL or MySQL backup is held outside the subscription entirely, so it outlives the server. Where that applies, the note says so rather than claiming the data is gone.
Where a recovery path stops covering the damage, the drawer shows a Does not cover note under the evidence. A critical caveat adds a small ! to the deletion cell; warning/info caveats still need review in the drawer. The cell keeps its color: the answer has not changed, only the radius it covers.
Locks appear here too, as a Mitigation. A lock is prevention, not recovery — it blocks the Azure Resource Manager delete but creates no recovery point, does not stop data being deleted through the data plane, does not survive subscription cancellation, and can be removed by any Owner or User Access Administrator. It never turns a cell green.
Reading the heatmap
| Mark | Meaning |
|---|---|
| ● | Meets the objective for that scenario |
| ▲ | Breaches the objective |
| ✖ | No recovery path exists. Not slow — none |
| ? | Unknown or undetermined. A source/fact or an objective comparison could not be determined |
| · | The scenario does not apply to this resource |
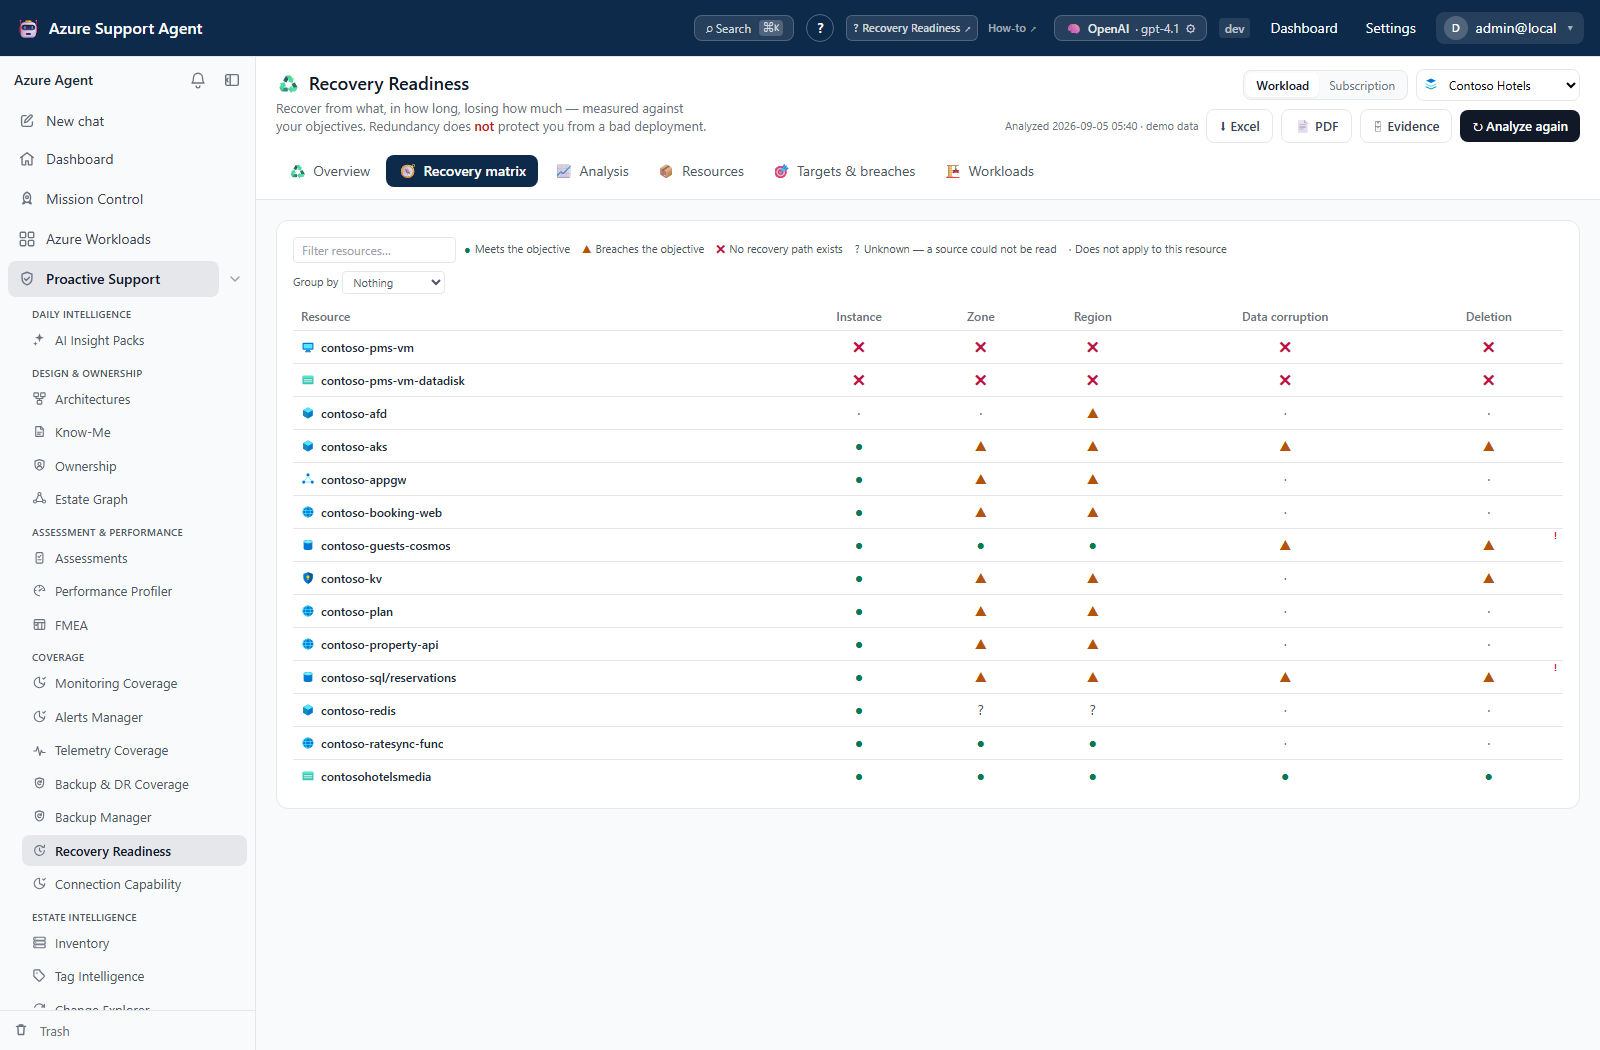
A row that is healthy on the left and red on the right is a resource every redundancy check calls resilient.
unknown is not not protected
They are opposite facts and the screen never merges them.
unknown means a source could not be read — most often that Backup Manager has not analyzed this scope yet, because its analysis is explicitly operator-triggered. It is not a statement that the resource is unprotected. If you see a lot of unknown, run a Backup Manager analysis for the same scope and re-run this one.
Also distinguish an unmapped protection datasource, unreadable native settings, and an absent numeric RPO. A known RTO with unknown RPO remains undetermined against its objective, not a pass. not_applicable means the model excludes that scenario (for example, logical data loss for a stateless component), not that recovery succeeded. There is no separate not_modelled verdict in the current wire model; unsupported types can be outside collection entirely.
If configuration enumeration fails, the page shows This scope could not be read on every tab and dashes for Overview counts. A failed saved-snapshot read instead offers Retry saved analysis; failed scenario metadata offers Retry scenario definitions while available resource data remains visible. None of these states means a clean estate.
Inspect Backup Manager’s own generated time, source errors, and truncation before using the join. The current join treats an existing completed Backup Manager snapshot as known and does not propagate all its partial/truncated flags or original collection time into Recovery’s protection provenance. A quiet provenance row is therefore not proof that every protection fact was read. Narrow and re-analyze incomplete scopes before issuing an assurance report.
none is not a degree of “slow”
✖ No recovery path means there is no mechanism that recovers this resource from that failure. It is a different kind of finding from “slower than you wanted”, and it is usually a surprise.
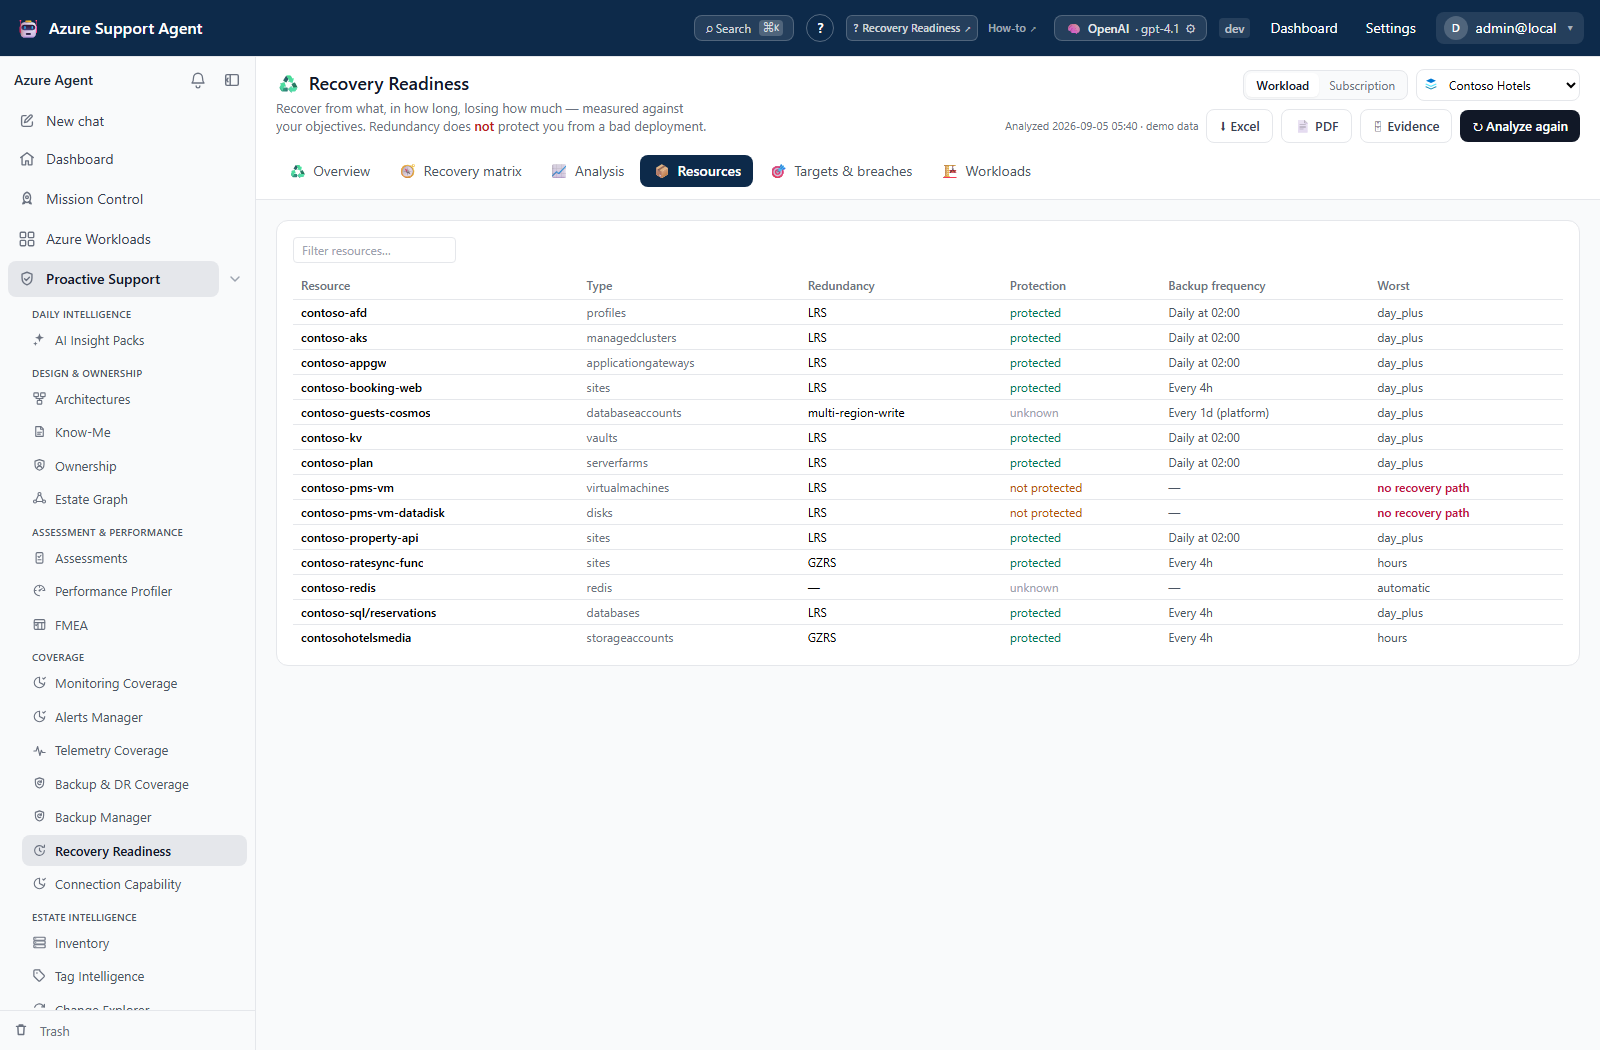
Resource register
Resources is the flat register behind the scenario views. Use it to locate a resource and inspect its protection state and worst modeled outcome, then open the reasoning before treating that summary as a recovery commitment. Unknown source facts and types outside the collector catalog are not proof of no protection.
RTO is a class, not a promise
You cannot measure a recovery time without performing a recovery. Everything here is inferred from configuration, so recovery time is reported as a capability class:
| Class | Meaning |
|---|---|
| Automatic | failover with no action and no data movement |
| Minutes | automated failover, warm standby |
| Hours | orchestrated failover or geo-restore |
| A day or more | restore from backup — depends on data volume |
| No recovery path | nothing recovers this resource from this failure |
| Unknown | not enough was readable to say |
Where a duration is shown it is a range with its assumptions printed, for example 6–14h · assumes 120 GB at 40 MB/s · unverified. The word unverified is doing real work: no drill has confirmed it.
Derived is not proven. Nothing on this screen is evidence until a recovery drill confirms it.
No duration band is produced for Automatic, No recovery path, Unknown, or a non-applicable scenario. Missing numeric RPO remains unknown; it is not zero. For other RTO classes, unknown size currently widens a low-confidence band using an explicit roughly 100-GB assumption. The class and band describe different aspects of the model and are not a measured completion deadline. Check the named rate actually used in the assumptions; not every constant listed in the reference is used by every mechanism.
RPO combines schedules, observations, and platform assumptions
The derived recovery-point figure is not always a live measurement:
- a policy that runs daily has a 24-hour worst case — not twelve; at 01:59 you are 23 hours 59 minutes from the 02:00 recovery point;
- a four-hour policy whose window is 08:00–18:00 has a 16-hour worst gap after its 16:00 run, because nothing runs overnight;
- Site Recovery reports its own measured replication lag;
- platform backup mode is read where available, but several cadence/replication values are model constants (for example SQL/PostgreSQL 10 minutes, MySQL/blob PITR 5 minutes, and asynchronous Storage geo-replication 15 minutes). Read the basis and confidence rather than calling each number exact or SLA-backed.
Where the configured schedule and the newest recovery point disagree, reality wins and the gap is itself reported — a daily policy whose job has failed for six days has a 24-hour design and a 144-hour reality.
That drift rule uses an observed age greater than 1.5 times the configured interval. If no recognized schedule reaches the joined item, the engine can use recovery-point age alone; do not assume a displayed policy name means its schedule was joined. Missing schedule and recovery-point data cannot establish a numeric RPO.
Objectives and breaches
Objectives are set per criticality tier per scenario, because a single number across all failure modes is meaningless — nobody demands fifteen-minute recovery from ransomware, and nobody accepts a day of data loss from a zone blip.
The product ships defaults so the screen is useful immediately. Excel, PDF, and Save to Evidence return HTTP 409 only when the saved snapshot contains breaches and the live reference has targets_acknowledged=false. A report with no stored breaches can export while unacknowledged; this is not proof it is complete or healthy. A missing analysis returns HTTP 400. Acknowledgment needs resiliency.admin and takes effect without re-analysis.
Breaches are ordered by consequence — no recovery path first, then total data loss, then the size of the miss weighted by tier. A mission-critical database missing its objective by an hour outranks forty low-tier machines missing theirs by a day.
Changing the objectives, and the constants behind them
The Targets tab has a second view, Objectives & rates, which exposes the editable objectives and throughput/overhead constants used by duration bands. Other platform cadence assumptions are part of the model, not editable controls in this view. A duration band derived from an invisible throughput figure is not reviewable, and the first thing a skeptical engineer asks is where it came from.
So the view shows two things together:
- The objectives — a target RTO class and a target RPO in minutes, per tier, per scenario.
unknownis deliberately not offered as a target: it means a source could not be read, and an objective of “we do not know” is one nothing can ever breach. - The restore rates and fixed mechanism overheads — the throughput assumptions and the per-mechanism minutes that produce every duration band. These are starting points, not truths. If you have measured your own restore throughput, put it here; every band names the rate that produced it.
Everybody with read access can see these constants. Changing them needs resiliency.admin. Unknown rates, tiers, scenarios, and invalid RTO classes are listed by name in Some values were refused. This is not all-or-nothing rejection: known restore rates are clamped to 1–100,000 with a warning, mechanism minutes to 0–10,080, and target RPO to 0–525,600. Reopen the saved reference and verify the accepted values. Saving retains up to 50 outgoing revisions, but this feature has no revision-restore control/API.
After changing objectives or rates, re-analyze before exporting: stored verdicts do not recompute on reference save, while the report’s reference sheets read the current registry. Editing the values does not automatically clear a previous acknowledgment. Review that governance state explicitly instead of assuming acknowledgment is tied to the current version.
Workload roll-up
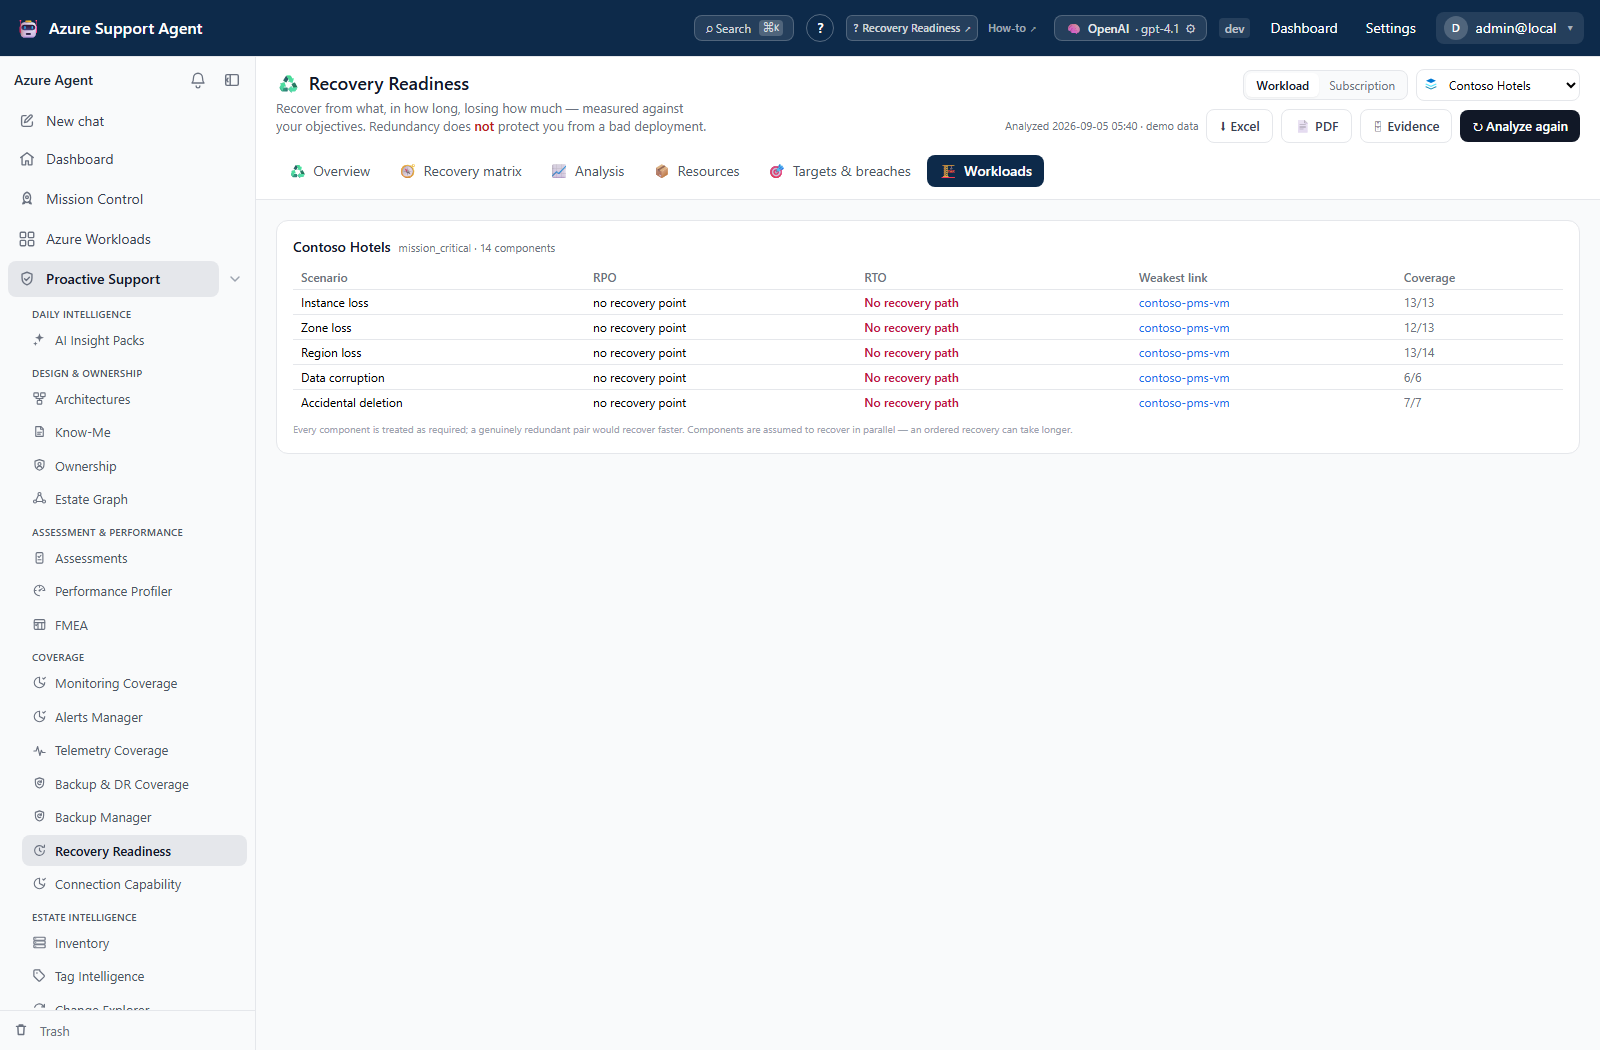
Per-resource answers do not tell you what your application’s recovery time is. The Workloads tab aggregates them and, more usefully, names the component that sets the number.
“Contoso Hotels: a day or more, because of one un-backed-up legacy virtual machine” is a work item. “Contoso Hotels: a day or more” is a statistic.
Two assumptions are stated on the screen rather than hidden:
- every component is treated as required — a genuinely redundant pair would recover faster, so the figure is conservative;
- components are assumed to recover in parallel — an ordered recovery can take longer than the figure shown.
Undetermined components are excluded from the aggregate and counted next to it, so a quarter-measured application cannot look fully assessed.
More precisely, Coverage counts determined RTO classes, not complete RPO evidence. RPO is rolled up separately: any none wins over numeric values, otherwise the largest known RPO is used, or unknown when none is numeric. An all-unknown RTO aggregate stays unknown. Subscription analysis currently groups its rows under Unassigned with the default tier rather than discovering all application memberships; use workload scope for an application-specific roll-up.
Analysis: which resource types are weak, and why
Per-resource answers tell you what is broken. They do not tell you what to do, because the same misconfiguration usually recurs across dozens of resources.
The Analysis tab groups the estate two ways:
- RTO and RPO by resource type, per scenario — ranked by consequence, with a dominant reason column. “42 of 44 storage accounts have no region recovery, all because their vault is locally redundant” is one change; forty-two rows is a backlog.
- The reason index — a bounded list of distinct verdict reasons, ranked by how much of the estate each explains. Working down this list moves more resources than working down a resource list.
Three renderings on this screen are deliberate and will not be softened:
- There is no average RTO.
unknownis not a point on the scale, so a mean over it is undefined — and it would be the single most quotable number on the page. Worst class and the distribution behind it are shown instead. - A median RPO always shows how many resources it excluded. A median over 41 of 44, presented as the answer for a type, is a lie of omission.
undeterminedis its own column, never folded into a rate. In the type table it counts unknown RTO classes; RPO excl. separately counts unknown/absent recovery points. Neither is interchangeable with the objective-comparison state.
Above the table sits the finding the whole feature exists for: redundant resources whose answer for corruption or deletion is at least two RTO classes worse than their answer for infrastructure loss. A Cosmos account with multi-region writes recovers from a region loss automatically and needs a day or more to recover from a bad deployment. Every redundancy check calls it resilient.
The comparison uses the worst determined zone/region RTO, not the most favorable infrastructure answer; logical no-path cases are also included. The reason index is bounded (25 entries in the analysis API, 200 in Excel, 20 in PDF), so it is not every distinct reason in a large estate.
Trend
Each non-demo analysis launched here appends one small point — counts only, never resource rows — so a later report can say whether this is getting better or worse.
Two rules keep it honest:
- One measurement is not a direction. A single analysis shows no trend at all rather than a line through one point.
- An improvement caused by losing visibility is flagged, not celebrated. If “no recovery path” falls while “undetermined” rises, that is very often the same resources becoming unreadable, and the screen says so.
Gaps are real: a month with no analysis leaves a gap rather than an interpolated point. Demo data is never recorded, because a synthetic trend line printed beside real numbers is the kind of thing that gets quoted.
Trend retains 60 points per scope across 24 scopes. Its no-path and undetermined counts are resource–scenario pairs; one resource can contribute several. By contrast, the Overview/export headline uses the count for the single worst scenario, not the distinct union of every affected resource. Compare like-for-like scenarios and timestamps, not these two totals directly. Mission Control refreshes the snapshot through its own path and does not append this feature’s trend point.
Contributing to the Reliability score
A tenant should not score well on Well-Architected Reliability while holding resources that cannot be recovered at all. Recovery Readiness can therefore contribute three controls to the Reliability pillar in Assessments:
| Control | Fails when |
|---|---|
| Every resource has a recovery path for each failure it can experience | Any applicable scenario resolves to no recovery path |
| Redundant resources also have point-in-time recovery | A zone- or geo-redundant resource has no point-in-time copy, so corruption and deletion replicate with it |
| Resources meet their recovery objectives | A derived RPO or RTO is worse than the objective for the resource’s tier |
Two design points are deliberate:
- They are aggregate controls. One finding per affected resource explodes on a real estate, so each control is a single finding carrying a bounded sample of the resources behind it.
- They contribute nothing when there is no analysis. If Recovery Readiness has not been run for the workload, the controls report not applicable and are excluded from the score. Failing them would be reporting our own absence as your risk.
The contribution is off by default, under the assessments_include_recovery setting. Turning it on moves an existing tenant’s Reliability score, which reads as a regression to anyone tracking a trend line — that is a change to announce, not one to ship silently.
Reports
Two formats, with different jobs. They share the same saved-analysis and conditional acknowledgment gate with Save to Evidence: stored breaches plus an unacknowledged live reference cause HTTP 409. Export permission is resiliency.read; acknowledgment is resiliency.admin.
Excel — the complete artifact
Sixteen sheets, grouped and color-coded, including the index. This is the detailed artifact for pivoting and cross-checking the retained analysis, not an unbounded export of Azure:
| Group | Sheets |
|---|---|
| Overview | Summary, Trend |
| Analysis | RTO-RPO by type, RTO-RPO distribution, Reason index, Redundancy gap |
| Detail | Recovery matrix, Resources, Reasoning, Breaches, Workloads |
| Objectives | Objectives, Assumptions and rates |
| Trust | Provenance, Truncation |
Three of those exist purely so the file cannot mislead:
- Reasoning is one row per configuration fact — resource, scenario, evidence kind, detail, source. The matrix also carries the reasons joined into a single cell, which reads well but can be neither filtered nor counted, and reasoning nobody can group is reasoning nobody uses.
- Truncation says where the analysis stopped. The store caps rows; a file presented as complete that silently dropped its tail is worse than one that admits it, because only the second can be checked. When nothing was dropped it says so rather than showing an empty grid.
- Assumptions and rates carries the constants behind every duration band, so any figure in the workbook can be traced to a number somebody chose.
The Objectives sheet repeats an agreed/not-agreed status on every row. A caveat that appears only once is a caveat a filtered view can lose, and this one changes what every target in the file means.
PDF — the readable report
Cover, contents, executive summary, how to read it, trend, recovery by scenario, RTO/RPO by type, the dominant reasons, resources that cannot be recovered, breaches, workload roll-up, and three appendices.
- The headline is a count, not a score. “Twelve resources have no recovery path” is a work item; a score out of 100 invites comparison between estates that share none of the same assumptions.
- “How to read this report” comes before the numbers, not in an appendix. Every misreading it prevents turns a cautious report into a falsely reassuring one.
- Long sections are bounded. The matrix appendix caps at 1,500 rows, breaches at 500, type/scenario rows at 60, and reasons at 20. The shared worst-offender helper already limits the no-path list to 50 resources before the PDF’s own limit; a section’s omission message does not necessarily expose that upstream cap. Use the workbook’s matrix and provenance for detail, while remembering its stored-row limits.
An empty PDF no-path or redundancy-gap section can still use positive wording when other facts are unknown. Do not quote that sentence as an all-estate assurance: check configuration readability, RPO exclusions, retained-row bounds, and the actual matrix first. A collector cap, a stored-row cap, and a PDF presentation cap are separate limits.
Save to Evidence
Freezes analysis content in an immutable Evidence Locker snapshot — content, not a rendered PDF. A PDF’s hash proves only that the file has not changed; stored content can be compared with a later capture. The capture includes retained inventory and up to 2,000 finding projections, plus the current reference and assumptions. Finding projections contain basis/assumptions; full scenario caveats remain in the retained inventory. Re-analyze after reference changes so the saved verdicts and capture-time reference agree; the exporter does not reconstruct the reference that originally produced an older analysis.
Troubleshooting
| Symptom | Cause | Resolution |
|---|---|---|
| Counts are zero with “This scope could not be read” | Configuration enumeration failed, not a clean estate. | Repair scope/Reader access, narrow the scope if needed, and analyze again before quoting counts. |
| A resource is absent or has no numeric result | Its type may be outside the supported catalog, the relevant fact may be unreadable, or the scenario may be non-applicable. | Check the catalog, Configuration drawer, basis, and source bounds; do not replace missing values with zero. |
A known RTO cell still shows ? | RPO or objective comparison is undetermined. | Inspect the recovery-point source and objective; refresh Backup Manager for the same scope and re-analyze. |
| Export/Evidence returns 409 | Stored breaches exist and the live objectives are unacknowledged. | Have a resiliency.admin reviewer acknowledge in Targets; re-analysis is unnecessary for acknowledgment alone. |
| Report objectives disagree with breach targets | Reference values changed after the stored analysis. | Review the saved values and acknowledgment, re-analyze, then export again. |
| “Some values were refused” appears after save | Some keys/classes were rejected or numeric values were clamped; other values may have saved. | Inspect the returned/saved reference, correct each field, and re-analyze. |
| Recovery looks complete but Backup Manager was partial | The join does not propagate every upstream completeness flag. | Review Backup Manager warnings and timestamps independently; restore visibility and rerun both analyses. |
| A run was interrupted after a restart | The durable status lease expired; this analysis has no resumable checkpoint. | Re-run explicitly. Reading job status does not restart Azure collection. |
What it does not do
- No changes to Azure. Analysis only. Remediation is Backup Manager’s job, and the drawer links there.
- No fault injection. Chaos testing needs write access to production.
- No drills. It reports what your configuration implies, not what a rehearsal proved.
Related pages
- Operate Recovery Readiness: inspect reasoning, breaches and repeated causes
- Backup Manager — inspect the live protection snapshot that supplies the join.