IAM: findings and scanners
Product permission: iam.read to view findings, the score and the scanner cards, and to run a scanner. iam.write to change a finding’s workflow state.
Purpose
App routes: /iam/findings — tab label Findings; /iam/scanners — tab label Scanners
These two tabs are one mechanism seen from two ends. The signal registry evaluates every check against the cached access snapshot and produces findings; a scanner is a named selection of those same checks with a cadence and a severity floor. Nothing in a scanner detects anything of its own — if a scanner ever needed its own detection logic, that logic would belong in the signal registry and the scanner would select it, because the same check written twice is two screens that eventually disagree about the same tenant.
The Findings tab answers what is wrong right now. The Scanners tab answers what changed since this check last looked.
Screenshot notes: These synthetic browser fixtures contain example findings and scanner cards, not a live collection or backend signal evaluation. Scanner names, selections and counts are illustrative rather than the shipped catalog or defaults. No scanner run or finding-state change was performed for the captures.
Prerequisites and data sources
- Product permission
iam.read. Changing a finding’s state additionally requiresiam.write, so an auditor can read a review without being able to suppress the findings they are auditing. - A cached access snapshot for the selected connection. Both tabs are computed from that snapshot and neither triggers an Azure call — including Run now, which evaluates the checks against the data already on disk. The scanner schedule and the collection schedule stay independently controllable, and a scanner can never be the reason an Azure call happened.
- Graph and per-scope coverage decide which checks can be measured at all. A check whose input was never collected is reported as unmeasured, never as a pass.
Tabs and actions
Findings
Served by GET /api/iam/findings, with the posture score from GET /api/iam/score and — only when you group by check — the signal catalog from GET /api/iam/signals.
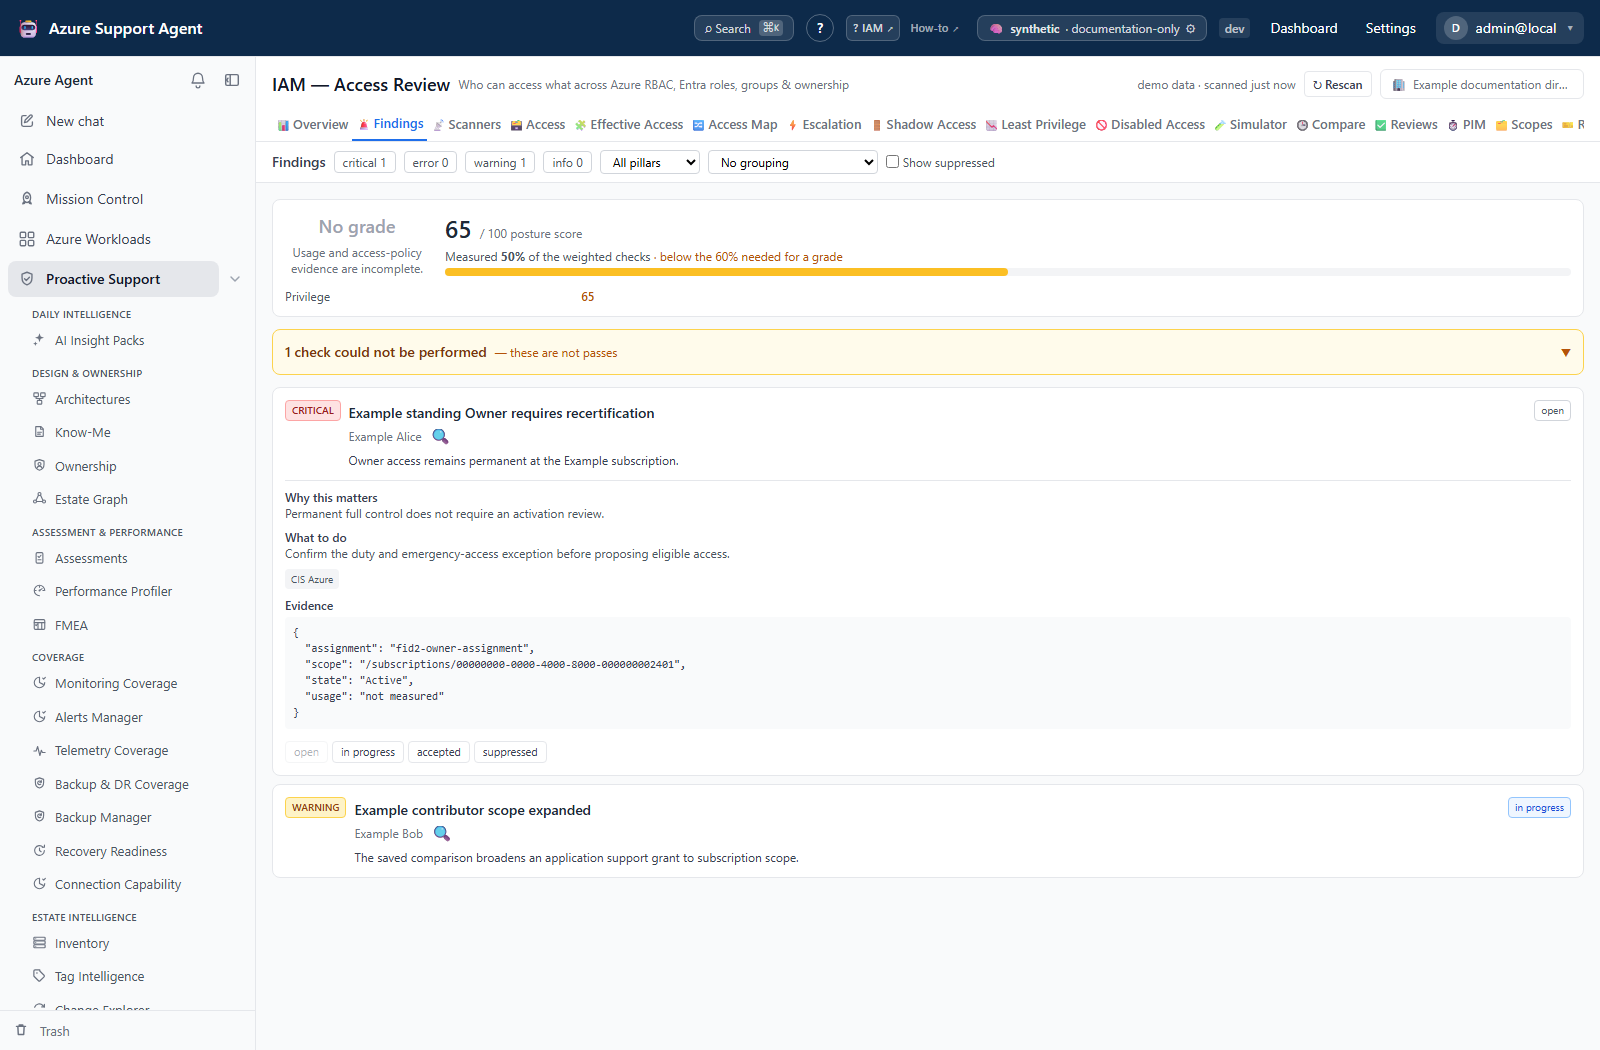
The score card, always with its coverage. The score is never returned without the share of weighted checks that were actually measured, and the letter grade is genuinely absent below the coverage floor rather than shown with an asterisk. A grade derived from a third of the checks would be quoted without the caveat, so the card renders “No grade” and the reason instead. Each pillar shows a number or its state — not measured for a pillar whose inputs were not collected, not built for one no check exists for yet — and never a 0 or a 100 standing in for either.
What could not be checked is given equal billing. A collapsible panel above the list names every check that could not be performed and why. Its heading says these are not passes.
Filters. Severity chips (critical, error, warning, info) toggle a single-severity filter; a pillar selector; Show suppressed. While the query is in flight the severity chips render an em dash, not a zero — on a large tenant this screen can take tens of seconds, and “critical 0” beside “Loading findings…” is the most reassuring possible rendering of “we have not finished looking”.
Two-level grouping, folded by default. The first selector groups by severity (default), pillar, check, affected object or state, or not at all. The second selector adds a sub-grouping — by check (default), pillar, severity, affected object or state — and never offers the dimension already in use at the first level, because nesting a section inside itself produces one child holding everything and a click with no information in it. Selecting the same dimension anyway falls back to flat rather than rendering that.
Both selections persist in the browser, so a reader who prefers a flat list keeps it. Sections start collapsed the first time a grouping produces them; the collapse state is keyed to the grouping, and a background refetch cannot re-fold a section you just opened. Collapse all and Expand all operate on both levels.
Sub-grouping exists because one check fires once per affected subject, so a severity section on a real tenant is largely the same check repeated against different principals. Grouped again by check, that collapses to one line with a count. A sub-group holding a single finding is rendered as the finding itself — a header over one card invents a hierarchy that is not there.
How the counts are computed, which is the part to read carefully.
| Number | Where it comes from |
|---|---|
| Severity chips in the toolbar | counts_by_severity — a server tally over the whole filtered set |
| A first-level section header | The server tally for that dimension (counts_by_pillar, counts_by_severity, counts_by_signal, counts_by_object_kind, counts_by_state), so it is the true size of the group for the current filter, not the size of the page |
showing N beside a section header | The number of that group’s findings the page could actually carry |
| A sub-section count | Counted from the page. The server publishes one tally per single dimension and there is no authoritative count for a (section, sub-section) pair, so the number is exact while its parent section is complete and is rendered as N shown the moment the parent was truncated |
N affected rows | The sum of each finding’s own occurrence count within what is on screen |
The distinction matters: a header count that shrank as you scrolled would be worse than no header count, so the first level is never derived from the rendered array. The second level is derived from it, and says so rather than printing a number that quietly means something narrower than it looks.
Grouping by pillar never omits a pillar. A pillar that produced no findings because it could not be measured is appended to the list with a note — not measured — the inputs for these checks were not collected, or not built — no check exists for this pillar yet — and never with a zero beside its name. Omitting it would render exactly like a pillar that was checked and came back clean, which is the one claim this screen exists never to make by accident. Pillar sections are ordered to match the score card above them.
Finding detail and state. Expanding a card shows why it matters, what to do, any framework references, and the raw evidence. Four states are available: open, in_progress, accepted, suppressed. State is stored against the finding’s fingerprint, so it survives re-evaluation — a collection run never clears somebody’s risk acceptance. Suppressed and accepted findings are dimmed and are excluded from the list unless Show suppressed is ticked. Where the affected object is a resolvable principal, an investigate affordance links to the identity view.
The UI requests the first 200 findings and has no paging control. The API permits 1–500 per page with an offset. Compare shown cards with server totals even when no truncation banner appears; use narrower filters or the workbook for a larger review.
Scanners
Served by GET /api/iam/scanners. Ten scanners are registered:
| Scanner ID | Name | Cadence | Severity floor | Selects |
|---|---|---|---|---|
iam.daily_critical | Daily critical sweep | daily | critical | Every critical signal, in every pillar |
iam.escalation_watch | Escalation path watch | daily | error | The escalation pillar |
iam.bypass_watch | RBAC bypass watch | daily | error | The bypass pillar |
iam.data_plane | Data-plane access | daily | warning | The data-plane pillar |
iam.drift | Access drift | daily | warning | The governance pillar |
iam.privileged_review | Privileged access review | weekly | warning | The privileged pillar |
iam.external_access | External access | weekly | warning | The external pillar |
iam.hygiene | Access hygiene | weekly | warning | The hygiene pillar |
iam.least_privilege | Least privilege | weekly | warning | The least-privilege pillar |
iam.full_posture | Full posture snapshot | weekly | info | Every pillar — the weekly baseline |
The severity floor is inclusive and works downwards from critical: a floor of warning reports critical, error and warning findings and drops info. Cadence is a hint to the scheduler, not a cron — daily means at least a day has elapsed, weekly at least seven — and a scanner that has never run is always due, so a newly added weekly scanner does not sit silent for a week.
Reading this screen never records a run. Every card is computed with persistence off. If a page load recorded a run, the first person to look each morning would turn everyone else’s “3 new” into “0 new”, and the feature would quietly stop reporting anything because somebody looked. The only path that writes a baseline is Run now on a card, or Run all now, and both are POSTs for exactly that reason.
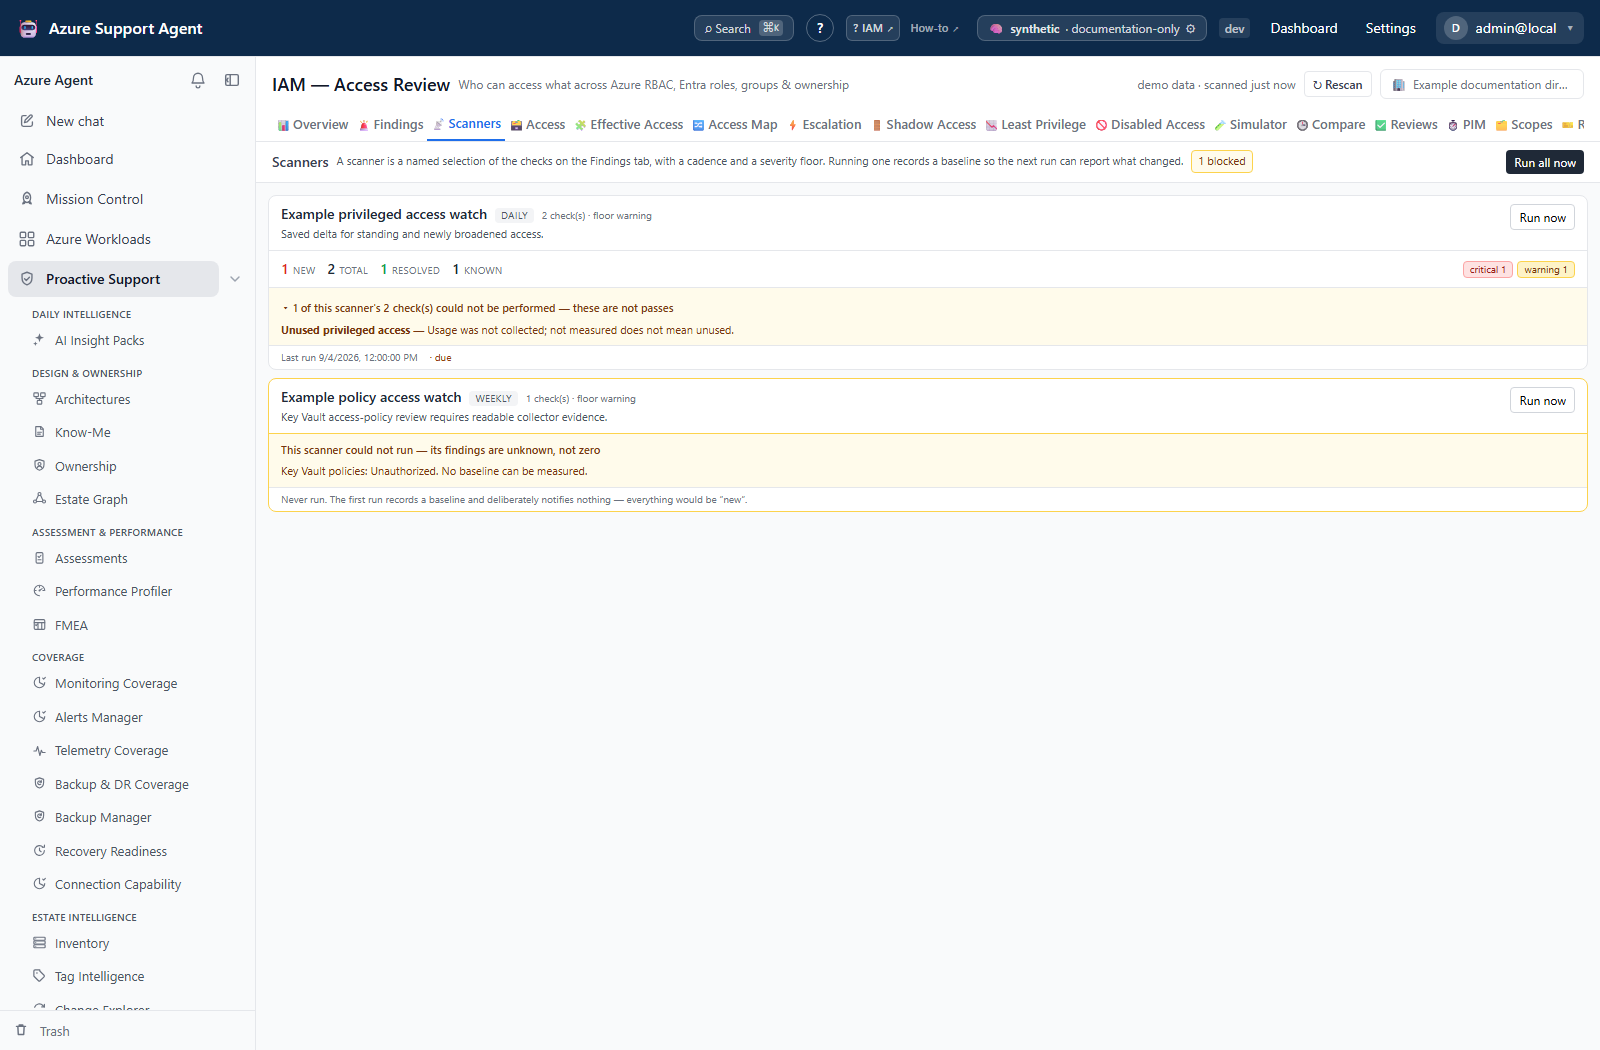
A blocked scanner publishes no number at all. A scanner is blocked only when every signal it selects came back unmeasured. Its card then shows an amber panel — this scanner could not run — its findings are unknown, not zero — with the distinct reasons, and withholds the counts entirely. On a real tenant a green “0 findings” card is the single most dangerous thing this screen could render.
A card that did report still names what it could not check. A count drawn from three of eight checks is not the same fact as a count drawn from eight of eight, and an expandable line beneath the counts says which, listing each unmeasured check and its reason. It is worded these are not passes.
Card counts, in the order they appear:
| Figure | Meaning |
|---|---|
new | Fingerprints this scanner is reporting that were absent from its previous run. Rendered in red when above zero |
total | Everything this scanner reports right now, at or above its floor |
resolved | Fingerprints present at the previous run and gone now |
known | Fingerprints present at both runs |
new leads because it is the number a delta screen exists to publish, and total sits beside it as context — a digest that repeats hundreds of known findings trains people to filter the sender. Read them together: a scanner reporting new 0 next to a four-figure total has not found nothing, it has found nothing since it last looked. Any missing figure renders as an em dash rather than a zero.
Resolution is computed, never clicked. A fingerprint that stops appearing is resolved, and nothing on this screen offers a way to mark one resolved by hand. That is the only reason the resolved count can be trusted. First-seen and last-seen are recorded in a ledger kept deliberately separate from the workflow state on the Findings tab, so a scan updates ages on every run and can never touch a decision a human made.
First run. A card that has never run says so and states that the first run records a baseline and deliberately notifies nothing, because everything would be new.
After running, a confirmation states that the baseline was recorded and that the counts now describe changes since that run.
Delivery
Running a scanner can publish its delta to the notification center; both run endpoints take a notify flag that defaults to on. The delivery policy is:
- a new finding whose signal is on the always-immediate list is published on its own, at its own severity, as soon as it appears;
- everything else new is published as one digest per scanner, with an exact count and a capped number of worked examples;
- resolutions are published as a single informational line, never one per fingerprint;
- a blocked scanner publishes the fact that it is blocked, once, and nothing else. Silence from a broken check is indistinguishable from silence from a clean tenant, and only one of those is good news.
Eleven signals bypass the digest: byp.rbac_not_only_door, dp.credential_store_access, esc.escalation_to_owner, esc.escalation_from_guest, esc.fic_loose_subject, esc.identity_hijack_available, gov.drift_self_grant, gov.drift_privileged_added, hyg.privileged_orphan, lp.role_authorization_write and priv.classic_administrators. Each is a state change that either indicates active compromise or removes a control that was protecting the tenant.
Freshness and scope behavior
Both tabs read the cached snapshot and neither refreshes it. A finding is only as current as the last access collection, which is stated by the freshness indicator in the page header — see IAM. Running a scanner against a stale snapshot produces a delta about stale data, not about Azure.
Neither tab honours the scope and workload filter rail; both are tenant-wide for the selected connection.
Workflow overview
- Check the header freshness before reading anything. If the snapshot is old, rescan first.
- Open Findings. Read the coverage figure on the score card and open the unmeasured panel before reading the list. A short list on a tenant with half its checks unmeasured is a coverage problem, not a clean result.
- Group by severity, then by check. Work the critical section first; the collapsed headers are the summary.
- Expand a finding for its evidence, then verify the claim against Azure or Entra before acting on it.
- Record a state on anything you have decided about. Use
acceptedfor owned risk andsuppressedfor an irrelevant finding. The current buttons send an empty reason; the API accepts an optional reason up to 1,000 stored characters. Record the rationale through the API or an approved change record rather than expecting a reason dialog. - Open Scanners and run the scanners relevant to what you just changed, so the next run’s delta is measured from a baseline you understand.
Interpretation of results
- An empty findings list is never an all-clear. The empty state says so explicitly and points at the unmeasured panel.
new: 0means nothing changed, not that nothing is wrong. Readtotalbeside it.- A blocked scanner is a coverage defect, not a passing check. Fix the collection, then re-run.
- Severity is the signal registry’s classification. It is a prioritization aid; the evidence on the card is what supports a decision.
- Suppressing a finding changes only this product. Nothing is written to Azure and nothing is exempted anywhere else.
- Sub-group counts are page counts. When a section says
showing N, treat every count inside it as a floor.
Exports, history, scheduling, and integrations
- The multi-sheet Excel workbook from the Overview tab (
GET /api/iam/export/workbook) carries the findings, the checks that could not run, the scanner cards and the posture score. The analysis sheets are deliberately tenant-wide even when the access sheets are filtered — a finding about a scope you filtered out is still true. GET /api/iam/frameworksmaps the current results onto control frameworks, including the controls that could not be measured. No screen renders it today.- Finding state changes and scanner-driven notifications are recorded in the audit log.
- There is no in-product scanner schedule editor.
POST /api/iam/scanners/runruns every scanner whose cadence has elapsed, or all of them withforce, and is the endpoint an external scheduler would call. GET /api/iam/scanners/{scanner_id}/findingsreturns everything one scanner reports, with first-seen dates and ages, and is read-only in exactly the same way as the card list. It is available in the API client but no screen currently renders it; use the Findings tab filtered by check, or the workbook, to see the same rows.
Safety and limitations
- Neither tab writes to Azure. A scanner run writes only this product’s own baseline, and a state change writes only this product’s own workflow record.
- Suppression/acceptance hides a finding from the default list but does not alter the IAM score or raw scanner selection. A scanner may continue reporting accepted risk; do not confuse workflow state with detector resolution.
- Running a scanner is gated on
iam.read, the same permission as viewing the tab. Changing a finding’s state is the stricteriam.write. - Findings inherit every limitation of the snapshot they were computed from: uncollected scopes, missing Graph context, unreadable data-plane authorization and unsupported access surfaces all reduce what can be measured, and are reported as unmeasured rather than absorbed into a pass.
- The findings page is capped and paged; broad reading should be done through the workbook rather than by scrolling.
- The posture score is a weighted projection of the same registry. It is comparable to itself over time on one tenant, not across tenants with different coverage.
Troubleshooting
| Symptom | Check |
|---|---|
| A scanner card shows an amber “could not run” panel and no counts | Every check it selects was unmeasured. Read the listed reasons, fix the collection or consent gap, rescan from the page header, then run the scanner again. |
A scanner reports new 0 but total is in the hundreds | Expected. The delta is measured against that scanner’s previous run, and nothing has appeared since. The open backlog is total; work it on the Findings tab. |
Everyone’s new count dropped to zero and nobody ran anything | Somebody used Run now or Run all now, which records a baseline. Viewing never does this. The findings themselves are unchanged — read total. |
| A finding reappeared after being marked resolved | Resolution is computed from a fingerprint that stopped appearing. It has started appearing again, which is a real recurrence, not a state bug. |
| A finding I suppressed is back in the list | Either Show suppressed is ticked, or the underlying condition changed enough to produce a different fingerprint. State is keyed to the fingerprint. |
| The score shows “No grade” | Coverage is below the floor required for a grade. The card states the reason and the percentage; increase coverage rather than reading the number as a bad score. |
| A pillar section says “not measured” with no findings | The inputs for that pillar’s checks were never collected. Check Diagnostics for the collectors that could not read. |
| Section counts do not add up to the number of cards on screen | The section header is a server tally over the whole filtered set; the cards are one page of it. The showing N marker beside the header states the difference. |
| A sub-section count looks too low | It is counted from the page and is labeled N shown whenever its parent section was truncated. Narrow the filter to make the section complete. |
Severity chips read — | The findings query has not resolved. That is deliberately not a zero. |
| Changing a finding’s state returns a permission error | State changes require iam.write; viewing requires only iam.read. |