How to use Recovery Readiness
Concept and vocabulary live in the user guide. This page is the task list.
Screenshot context: These native application examples use isolated synthetic demo data, not live Azure evidence. Demo Azure writes are disabled. Durations and recovery points are modeled examples, not drill measurements, and the captures do not establish that an organization reviewed or acknowledged its objectives.
Prerequisites
resiliency.readfor every task on this page. Setting objectives and editing restore rates additionally needsresiliency.admin.- For live data, an enabled Azure connection with a workload or subscription in scope.
- For live protection facts, a Backup Manager analysis of the same scope. Without its snapshot, the protection join reports
unknown, not unprotected; Recovery Readiness analysis can still run. - Recognized catalog demo workloads need neither an Azure connection nor a prior Backup Manager analysis. The demo workload must already be available in Workloads; loading demo data separately requires
demo.manage.
Route
Proactive Support → Coverage → Recovery Readiness (/resiliency), with six tabs: Overview, Recovery matrix, Analysis, Resources, Targets & breaches, and Workloads.
How to run your first analysis
- Open Proactive Support → Coverage → Recovery Readiness.
- Pick a workload or subscription. The page loads any saved analysis and current job status; this does not launch a new analysis.
- Click Analyze recovery posture.
Analysis starts explicitly. When a run finishes, the page reloads its saved results, including the Analysis tab, trend, and resource detail. Re-run it when you want fresh figures.
Expected result: A saved analysis for the selected scope, with source provenance and a generated time.
Verification and safety: Confirm the scope and analyzed timestamp; inspect unreadable-source warnings before interpreting a missing protection fact. Workload/subscription are the UI scope modes; management-group requests are API-only here. A saved-report read error is not “no analysis”: use Retry saved analysis. For missing column definitions, use Retry scenario definitions without discarding available resource data.
How to prepare the live protection join
For live scopes, Recovery Readiness reads the backup estate from Backup Manager’s analysis, which is itself operator-triggered. If Backup Manager has never analyzed this scope, protection facts from that join report unknown.
- Run Backup Manager → Analyze backups for the same scope and connection.
- Inspect its generated time, source errors, per-vault warnings, and truncation before accepting protection facts.
- Run Recovery Readiness after that result completes. Catalog demos supply synthetic protection facts directly and do not need this preparation.
Expected result: Recovery uses the completed Backup Manager snapshot for its protection join.
Verification and safety: Recovery does not propagate every Backup Manager partial/truncated flag or original collection timestamp into protection provenance. Check the upstream analysis itself; a quiet Recovery provenance row is not proof of complete backup coverage.
How to analyze a demo without an Azure connection
- Open
/resiliencywith a recognized catalog demo workload already available in Workloads. - Choose Workload and select that demo workload. No Azure connection is required. For API requests, omit
connection_id; supplying an invalid ID does not activate the demo path. - Select Analyze recovery posture if a report is absent or you want to regenerate it.
- Open Recovery matrix, Analysis, and a resource drawer to inspect the synthetic configuration and protection evidence.
Expected result: A saved report marked demo data, without live Azure collection or a preceding Backup Manager analysis.
Verification and safety: Confirm the demo label and analyzed timestamp. Demo runs do not append trend points and must not be presented as evidence about a live estate.
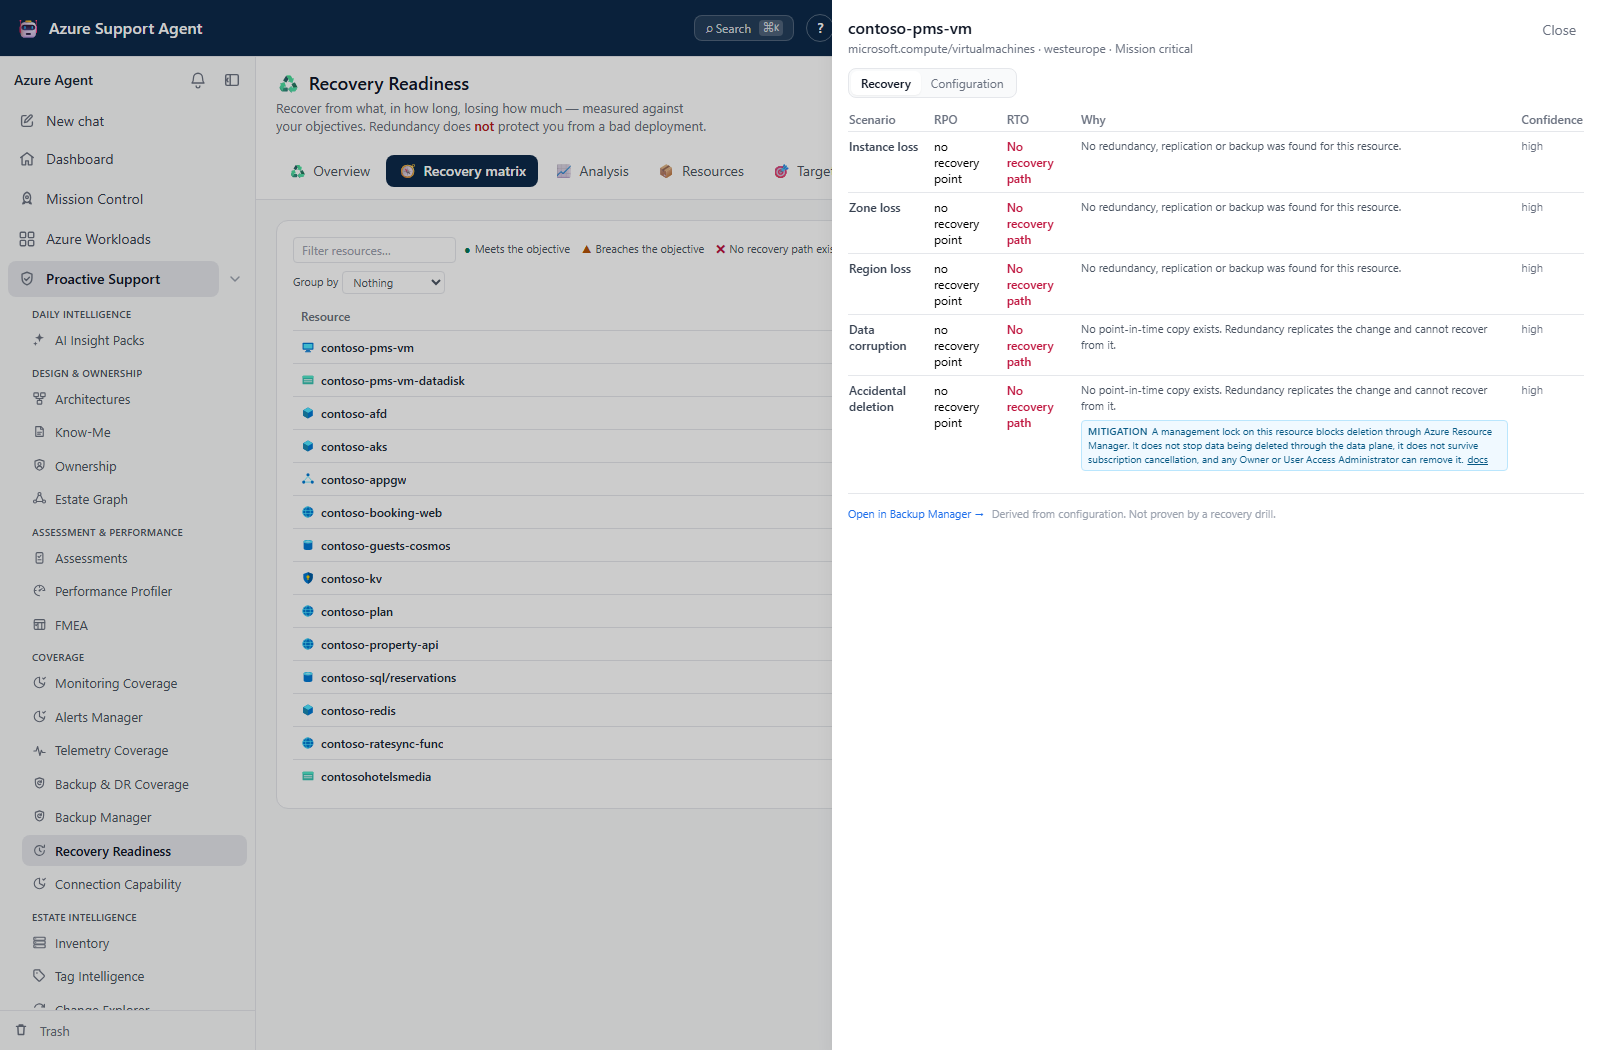
How to find what cannot be recovered at all
- Go to Overview.
- Look at No recovery path.
- Click any ✖ cell to open the resource and see why.
This is the highest-value output of the module. It is not “slower than you’d like” — it is that no mechanism exists for that failure.
The Recovery matrix tab is the same grid over the whole scope, filterable by name or type; Resources is the flat list with each resource’s worst class and portal link.
Expected result: The selected scenario’s missing mechanism is explained in the drawer, separately from slow or unknown recovery.
Verification and safety: The Overview headline counts the worst single scenario, not distinct resources across all scenarios. Trend counts resource–scenario pairs. Check basis and completeness before combining or quoting these numbers. Types outside the collector catalog may be absent, not labeled unprotected.
How to read a breach
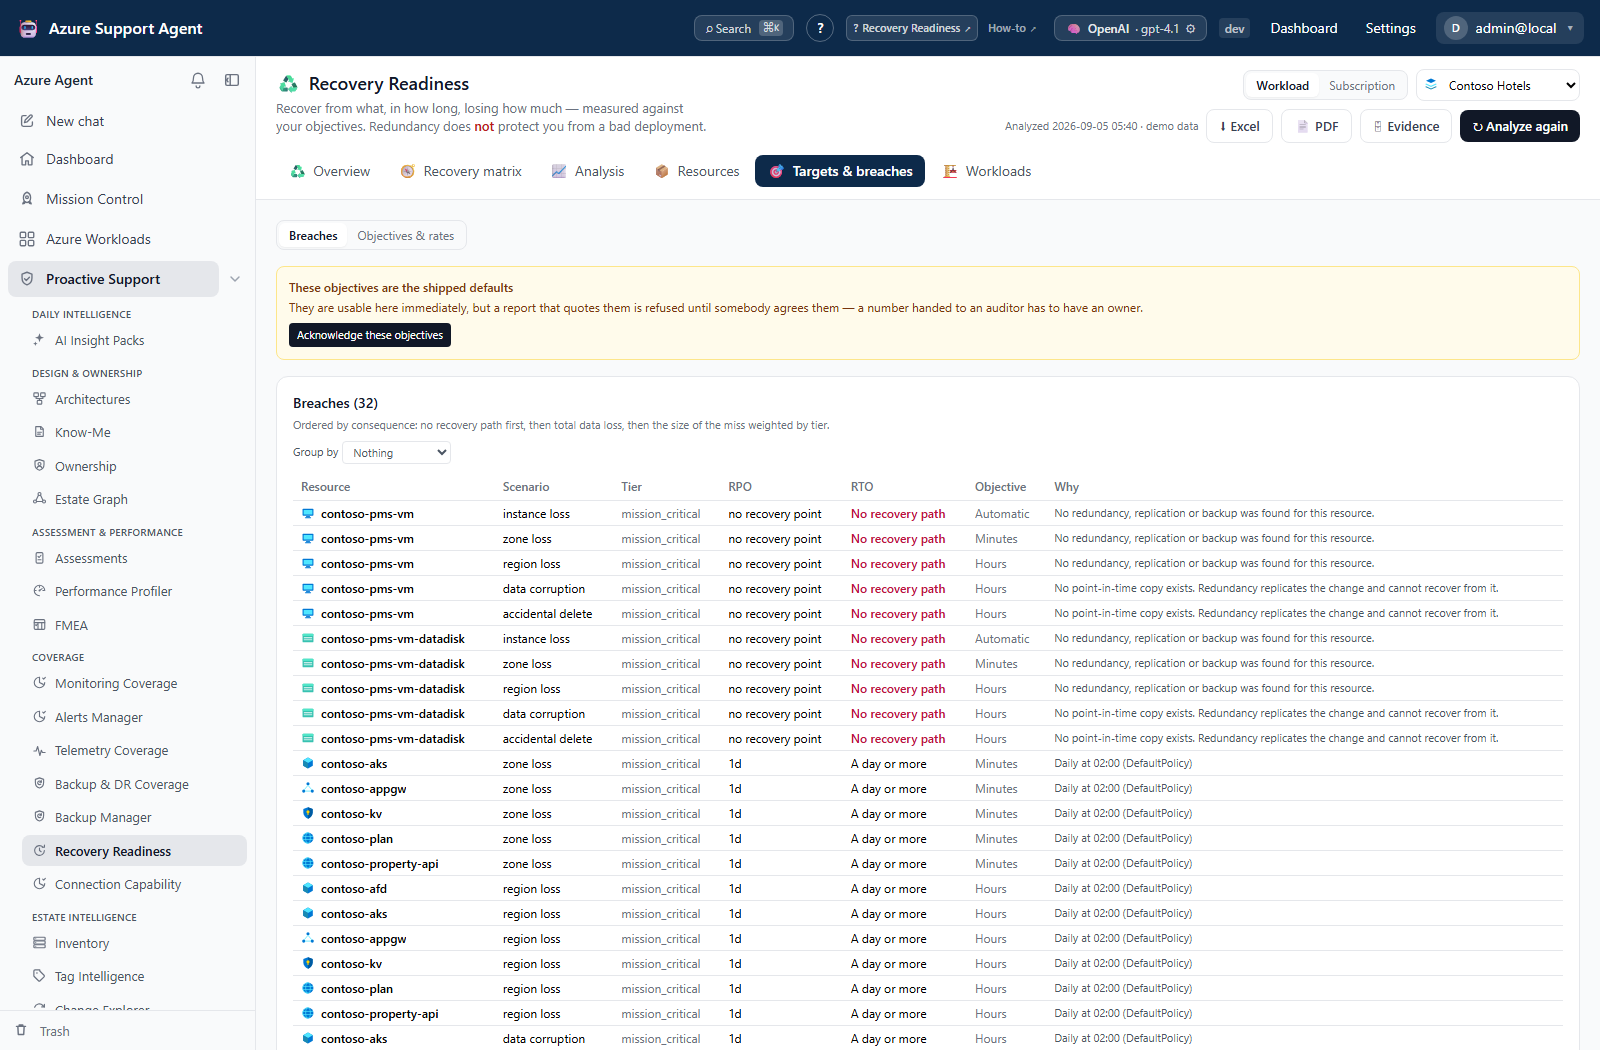
- Open Targets & breaches, which lists stored breaches in consequence order.
- Select a resource and read its scenario, derived value, objective, tier, and evidence.
- Check Configuration and the tier source before disputing the finding or planning remediation.
Each row shows the derived value, the objective, the tier that set it, and the evidence. If a row looks wrong, check the tier column first — a wrong tier is the most common cause of a disputed finding.
Expected result: A breach is traced to its scenario and objective rather than treated as one universal resource RTO.
Verification and safety: Unknown RTO or RPO yields an undetermined objective comparison, not a pass. A resource can have a known class without numeric RPO; inspect RPO excl. as well as the type table’s RTO-only Undet. count.
How to set your own objectives
Requires resiliency.admin.
- Open Targets, then switch to Objectives & rates.
- Objectives live per criticality tier, per scenario. Pick a target RTO class and a target RPO in minutes for each row.
- Select Save objectives and rates, then reopen the saved values to confirm what was accepted.
- Review Acknowledge these objectives in Targets separately. Changing values does not automatically clear an earlier acknowledgment.
- Re-analyze after changing objectives/rates so stored verdicts match the current reference before exporting.
A resource inherits its tier from its workload’s criticality, so set that first in the workload registry rather than overriding resources one at a time.
Validation has two important boundaries:
unknownis not offered as a target RTO. It means a source could not be read; an objective nothing can ever breach is not an objective.- Unknown tiers/scenarios/rates and invalid RTO classes are named in Some values were refused, but a save is not all-or-nothing: known restore rates are clamped to 1–100,000 with a warning, mechanism minutes to 0–10,080, and target RPO to 0–525,600. Other valid values can still save.
Expected result: The application reference version and saved values update; no Azure resource changes.
Verification and safety: Excel, PDF, and Evidence return 409 when the saved snapshot has breaches and the live reference is unacknowledged. No-breach snapshots are not blocked solely by acknowledgment. Acknowledgment alone takes effect without re-analysis, but editing objectives does not recompute old verdicts or pin acknowledgment to the edited version.
How to tune the restore rates
Requires resiliency.admin. Same place: Targets → Objectives & rates, lower panel.
- Read the current throughput and fixed-overhead assumptions, including their units.
- Enter measured local rates or reviewed overheads and select Save objectives and rates.
- Inspect saved values and any refused/clamped fields, then analyze again.
- Open a resource’s assumptions and confirm the specific rate/mechanism actually used in its band.
Duration bands are computed from throughput rates in the reference registry. The shipped values are starting points, not truths. If you have measured your own restore throughput, set it — every band names the rate that produced it, so the change is visible in the report.
The fixed mechanism overheads next to them (failover time, vault restore overhead, detect-and-decide) are editable for the same reason. Anyone with read access can see every one of these constants even without resiliency.admin, because a band derived from a number nobody can inspect is not reviewable.
Bands widen and confidence drops when the data volume is unknown. That width is deliberate; it is the honest signal that the estimate is weak.
Expected result: Newly analyzed duration bands use the applicable saved constants and show their assumptions.
Verification and safety: Unknown size currently uses an explicit roughly 100-GB assumption. Automatic, unknown, no-path, and non-applicable verdicts have no numeric duration band. Not every reference constant is used by every mechanism; missing numeric values must not be filled with zero or presented as measured RTO.
How to find the fix that moves the most resources
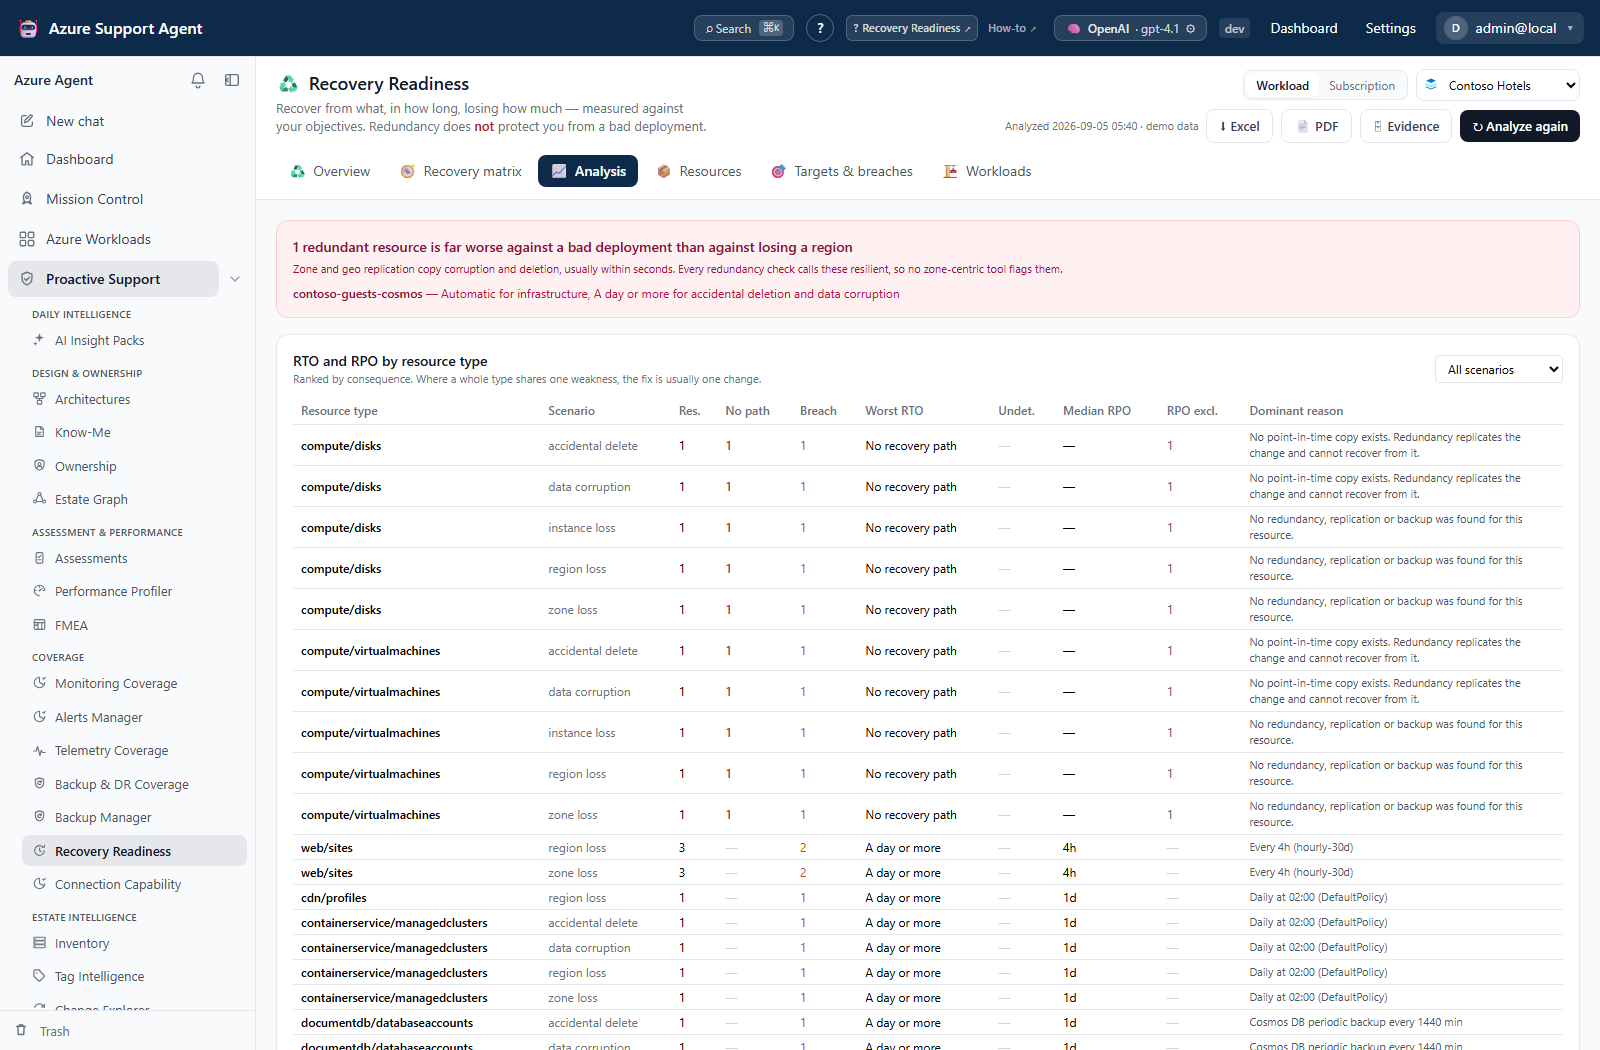
Open Analysis. Two tables, both ranked by consequence:
- RTO and RPO by resource type — start at the top. The Dominant reason column names the one thing that explains the most resources in that row.
- Why — the reasons that explain the most — the same reasons across the whole estate, with how many resources each accounts for.
Reading these columns correctly matters:
- Undet. is resources whose verdict could not be determined. It is counted separately from everything else, never folded into a rate.
- Median RPO covers only resources whose recovery point could be measured. RPO excl. is how many it left out; a median quoted without it describes fewer resources than the reader will assume.
- A resource type that cannot experience a scenario is absent from that scenario, not shown as meeting its objective.
The panel above the tables lists redundant resources whose corruption/deletion answer is at least two RTO classes worse than their infrastructure answer. Those are the rows no zone-centric tool flags.
Expected result: Repeated causes become a prioritized investigation list rather than an unsupported all-estate score.
Verification and safety: The gap uses the worst determined zone/region answer and also includes logical no-path results. The reason lists are bounded: 25 in the analysis API, 200 in Excel, and 20 in PDF. Undet. and workload Coverage count RTO determination, not complete RPO evidence.
How to export a report
Requires resiliency.read; acknowledgment additionally needs resiliency.admin.
- Confirm this scope has a saved analysis and review configuration/protection provenance and upstream Backup Manager completeness.
- If objectives or rates changed, re-analyze first. Reports pair saved verdicts with the live reference; they do not reconstruct the old analysis-time reference.
- If stored breaches exist and the live objectives are unacknowledged, have an authorized reviewer acknowledge them in Targets. Acknowledgment alone does not require re-analysis.
- Select Excel, PDF, or Evidence and inspect the completed artifact or the displayed error.
- ⬇ Excel — sixteen sheets including Index, based on retained analysis rows. Use this to pivot, cross-check, or hand over. Reasoning is one row per fact; Truncation reports stored-row caps, not every upstream collection omission.
- 📄 PDF — the readable report: executive summary, trend, per-type analysis, dominant reasons, unrecoverable resources, breaches, workload roll-up and appendices. Long sections are capped and state how many rows they omitted.
- 🗄 Evidence — freezes the analysis as an immutable Evidence Locker snapshot with a SHA, so it can be diffed against a later capture.
Both files are named recovery-readiness-<scope>-<date>, so exporting three subscriptions in a row leaves three distinguishable files.
Read the Provenance sheet, or Appendix C in the PDF, before drawing conclusions from an empty section. “No findings” and “could not look” are opposite facts.
Expected result: A downloadable report or frozen Evidence content, subject to the same conditional acknowledgment gate.
Verification and safety: No analysis returns 400; stored breaches plus an unacknowledged live reference return 409 for all three actions. A no-breach export can succeed unacknowledged and is not a health attestation. Neither format is unbounded: snapshots cap resources/breaches at 5,000 and workloads at 500; PDF further caps matrix rows at 1,500, breaches at 500, type/scenario rows at 60, and its upstream offender list at 50 resources. Evidence finding projections cap at 2,000. Do not quote positive empty-section PDF wording without checking unknowns and provenance.
How to roll it up per workload
- Analyze a workload scope and open Workloads.
- Inspect its worst class per scenario and select the weakest link to read the component evidence.
- Check Coverage, RPO state, and the assumptions that every component is required and recovery happens in parallel.
Each card gives the workload’s worst class per scenario and names the component that sets it. A genuinely redundant pair may recover faster; ordered recovery may take longer.
Expected result: A scenario-specific aggregate and an identifiable limiting component.
Verification and safety: Coverage excludes unknown RTO classes but does not count unknown RPO separately. RPO none overrides numeric values; otherwise the largest known value wins. All-unknown RTO remains unknown. Subscription scope currently groups rows as Unassigned rather than discovering each workload.
How to find what a parent deletion would destroy
The deletion column answers “can this resource be recovered”. It does not, on its own, answer “what if someone deletes the thing that contains it” — and for several Azure services those are different answers.
- Open the Accidental deletion column and look for cells carrying a
!. - Open the drawer and read the Does not cover note. It names the radius the recovery path stops at.
- Act on the ones that say unrecoverable:
- Azure SQL — configure long-term retention. It is the only backup that survives deleting the logical server.
- PostgreSQL / MySQL flexible server — five days is the whole window, and recovery is a management API call with no portal path. Enrolling the server in a Backup vault removes that cliff, because vaulted backups are held outside the subscription.
- Storage accounts — soft delete does not protect the account. Either apply a lock or use vaulted blob backup, which does survive account deletion.
A resource already protected by a Backup vault shows a softer note naming the tier, because vaulted and operational backups differ on exactly this question and the tier is not visible from Resource Graph.
In the workbook the same information is the Recovery limit and What it does not cover columns of the Recovery matrix sheet, so you can filter the whole estate by severity.
Expected result: The recovery mechanism’s supported deletion radius is understood alongside, not confused with, its verdict.
Verification and safety: A ! marks a critical caveat; warning/info limits still require reading the drawer. A lock is prevention, not a recovery copy. Verify the actual vault tier and service-specific recovery window before changing protection; this page does not execute the remediation.
How to ask the agent
With resiliency.read you can ask in chat:
- Analyze the workload and select its intended connection in chat.
- Ask a scoped question such as one below.
- Check the answer’s timestamp, basis, confidence, and deletion limits against the resource drawer.
- “What is the recovery posture for the payments workload?”
- “What has no recovery path for accidental deletion?”
- “Which databases would be lost if someone deleted their server?”
- “What misses its recovery objectives?”
Answers carry the configuration that produced them. Quote the basis, not just the number. The posture tool carries deletion does_not_cover caveats; the gap/breach projections do not all repeat them, so use the drawer or posture result when a limit is missing.
Expected result: A cache-only explanation of the analyzed workload, not a new live Azure scan.
Verification and safety: Chat separately needs chat.use, and tools can be disabled in settings. Posture is capped at 60 resources and gap/breach results at 100 rows; recovery_breaches is off by default. Do not treat a bounded answer as the whole estate.
How to add it to a mission
Recovery Readiness is a Mission Control system (♻️ Recovery Readiness). Add it to a mission to have it re-derived on the normal sweep. Its headline leads with the count of resources that cannot be recovered rather than a score, because a count is actionable and a score invites comparison.
- Open the intended workload’s mission with the necessary Mission Control access.
- Include Recovery Readiness and run the reviewed sweep.
- Follow its result into Recovery Readiness and verify the workload and analyzed time.
Expected result: The mission’s recovery step refreshes the saved recovery snapshot.
Verification and safety: Mission launch needs missions.run in addition to viewing recovery results. This execution path does not append Recovery’s own trend point. Do not infer a complete estate from a mission summary; inspect the scenario matrix and upstream protection visibility.
How to count it against the Reliability score
Off by default. To turn it on, set assessments_include_recovery in Admin → Settings.
- Review and announce the scoring-policy change; changing the setting requires
settings.write. - Analyze the intended workload in Recovery Readiness and check completeness.
- Enable the setting and run an Assessments evaluation including Reliability with
assessments.run. - Compare the three aggregate recovery controls and their bounded evidence samples, not only the total score.
Once enabled, an Assessments run that includes the Reliability pillar picks up three extra controls from the latest Recovery Readiness snapshot for that workload: resources with no recovery path, redundant resources with no point-in-time copy, and resources breaching their objectives.
Two things to expect:
- Existing scores can change, including moving down. That is why it is opt-in — announce it, or somebody watching a trend line may read it as an unexplained regression.
- A workload that has never been analyzed contributes nothing. The controls report not applicable and drop out of the score entirely. Run the analysis first, or the pillar is simply quiet about recovery.
Expected result: The current workload snapshot supplies three aggregate Reliability controls when enabled.
Verification and safety: An existing snapshot is not necessarily complete; these controls do not independently collect missing facts. Review unknowns first. Enabling the contribution can change scores, but does not necessarily lower every workload’s score.
Safety and rollback
Recovery Readiness is analysis only. It never changes an Azure resource, never starts a failover and never restores anything — remediation deep-links into Backup Manager, which owns its own approvals. There is nothing here to roll back in Azure.
Local application writes still need review:
- Objectives and restore rates. Saving retains up to 50 outgoing revisions, but this feature has no revision-restore UI/API. Re-enter reviewed previous values and re-analyze when correcting a change. Acknowledgment is a separate deliberate act and is not automatically reset by editing values.
- Analysis snapshots and trend points. Re-running replaces the stored snapshot and appends a counts-only point for non-demo analyses launched here. That replacement is not an undo history of full snapshots; both stores have a 24-scope cap and trend retains 60 points per scope.
- Evidence. A capture freezes retained analysis content and the current reference. Preserve only reviewed material; it is not an Azure restore or rollback.
Two cautions that are not about rollback but will cost you if missed:
- Enabling the Reliability contribution can change existing scores. Announce it before turning
assessments_include_recoveryon so a scoring-policy change is not mistaken for an estate regression. - Exports name real resources. Treat the workbook, the PDF and the Evidence Locker snapshot as governance material.
Related docs
- Recovery Readiness (feature reference) — the vocabulary, the five scenarios, and how each verdict is derived.
- Backup Manager — run this first for live protection facts; catalog demos supply synthetic facts directly.
- Backup & DR Coverage — is the estate protected at all, as opposed to how fast it recovers.
- Assessments — where the Reliability-pillar contribution lands.
- Evidence Locker — where a frozen analysis is stored and diffed.
- Permissions —
resiliency.readandresiliency.admin.
Troubleshooting
| Symptom | Cause and resolution |
|---|---|
Live protection facts say unknown | Backup Manager has not analyzed this scope or its snapshot could not be read. Analyze the same scope there, then rerun Recovery Readiness; this is not evidence that the resources are unprotected. |
| A demo request reports a missing, disabled, or mismatched connection | The request supplied an explicit connection, which is still validated. Correct that selection; API callers using the connection-free demo path must omit connection_id, not supply a nonexistent ID. |
A resource shows unknown protection | Its type is not mapped to a backup datasource. It is not unprotected — we did not look. |
| Export or Evidence returns a 409 | The saved snapshot has breaches and the live objectives are unacknowledged. A resiliency.admin reviewer can acknowledge them in Targets; acknowledgment alone needs no re-analysis. |
| A band looks implausible | Check the restore rate in the reference registry, and whether the resource’s data size is known. |
| A workload’s RTO looks pessimistic | Every component is treated as required. A genuinely redundant pair recovers faster than the figure shown. |
| Saving objectives lists refused values | Unknown keys/classes were rejected or rates clamped; other changes may have saved. Reopen the saved reference, verify each field and its bounds, correct it, and re-analyze. |
| Reliability score did not change after enabling the contribution | Recovery Readiness has not analyzed that workload, so its controls are not applicable. |
| Export returns nothing and shows an error | Read the message: no analysis returns 400; stored breaches plus unacknowledged live objectives return 409. Fix that condition, not the Azure write permissions. |
| The Trend panel says there is no direction | Fewer than two analyses have been recorded for this scope, or the scope is demo data, which is never recorded. |
| Trend improved but the caveat says otherwise | “No recovery path” fell while “undetermined” rose — the same resources probably became unreadable. That is a collection problem, not a recovery improvement. |
| The PDF omits rows the workbook has | PDF presentation and shared offender limits apply before rendering, and not every upstream limit is described by its omission text. Use the workbook matrix, then narrow and re-analyze if collection or snapshot caps also apply. The workbook is not unbounded. |
A known RTO has no numeric RPO or still shows ? | The model has a mechanism/class but lacks a recovery-point value or a determined objective comparison. Inspect Configuration, basis, and the Backup Manager snapshot; do not substitute zero. |
| Resource rows are absent with an unreadable-scope banner | Configuration enumeration failed. Correct the selected scope and Reader access, then explicitly analyze again; zero findings here do not mean low risk. |
| A type is absent without an unreadable-source warning | The collector only queries its supported type catalog. Verify modeling support and inventory separately; there is no universal not-modeled row for excluded Azure types. |
| Report reference values and breach targets differ | The reference changed after the saved analysis. Verify the accepted values/acknowledgment, re-analyze, then regenerate the artifact. |