Network and DNS Diagnostics
Product permission: netdiag.run for every endpoint of both tools.
Screenshot note: The native forms and result panels below use synthetic browser-only inputs and saved results. No DNS resolution, SSH command, TCP/TLS/HTTP connection, Azure read, or AI call occurred. The modeled verdicts are not live findings or proof of a network fault.
Purpose
Most of this product reads Azure’s control plane. These two tools do the opposite: they run a real probe from a host inside the network and then place Azure’s own configuration next to the result. That pairing is the point. A control-plane read can tell you a rule exists; only a probe can tell you the packet arrived.
- Test connectivity collects observations for one source, target, port, and protocol, with possible control-plane explanations.
- Debug resolution compares name-resolution observations from selected sandbox hosts and classifies the returned address.
Neither applies Azure configuration changes. They do send real network traffic, save application records, and may attempt to install missing tools on the sandbox when allowed. Choose approved targets and paths; do not assume an HTTP probe is harmless for every application endpoint.
Where they run from
App routes: /architectures/:id, and /inventory for the DNS tool.
| Tool | Launch point | Label |
|---|---|---|
| Test connectivity | Architecture canvas — right-click a node, or select a node and use the inspector panel | 🔌 Test connectivity |
| Debug resolution | Architecture canvas — right-click a node or use its inspector | 🧭 Debug resolution |
| Debug resolution | Inventory grid, on private-endpoint-eligible resources only | 🧭 Debug resolution |
Launching from a node pre-fills the target from that node’s fqdn, private_ip, or ip metadata. In Inventory the button appears only for private endpoints and for the resource types that commonly sit behind one — Storage, SQL, PostgreSQL, MySQL, Key Vault, Cosmos DB, Container Registry, Service Bus, App Service, and Cache.
Prerequisites
Both tools execute their probes over SSH from an onboarded Sandbox VM, because that is the only host the application has inside the customer network.
- At least one Sandbox VM registered and reachable. See Manage Sandbox VMs.
- Sandbox tooling enabled by an administrator. With it disabled, probes refuse to run.
- For the Azure-side evidence panels, an Azure connection that can read networking configuration in the target scope.
A source hostname or IP can be typed instead of picking a VM, but that only labels the run. Live probing still requires an SSH-reachable sandbox; entering a source with no VM behind it returns an explicit error rather than a silent empty result.
Test connectivity
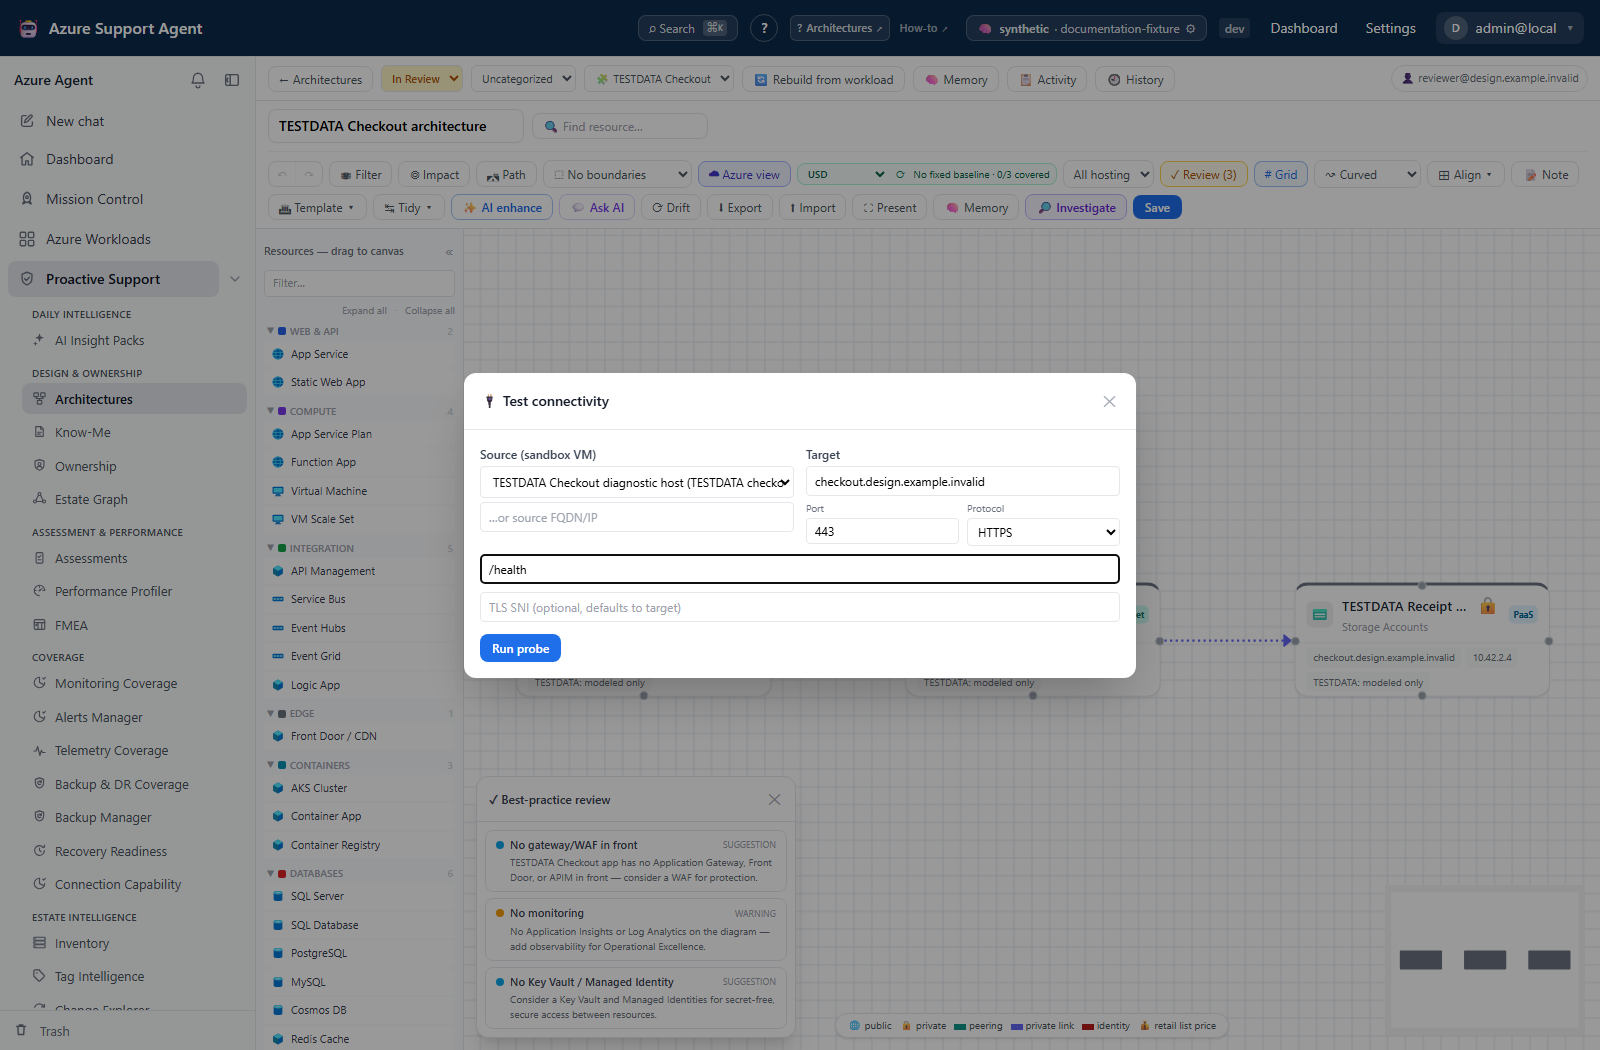
Inputs
Source VM, target FQDN or private IP, port (default 443), and protocol — tcp, tls, http, or https. HTTP path and TLS SNI appear when the chosen protocol uses them.
What it runs
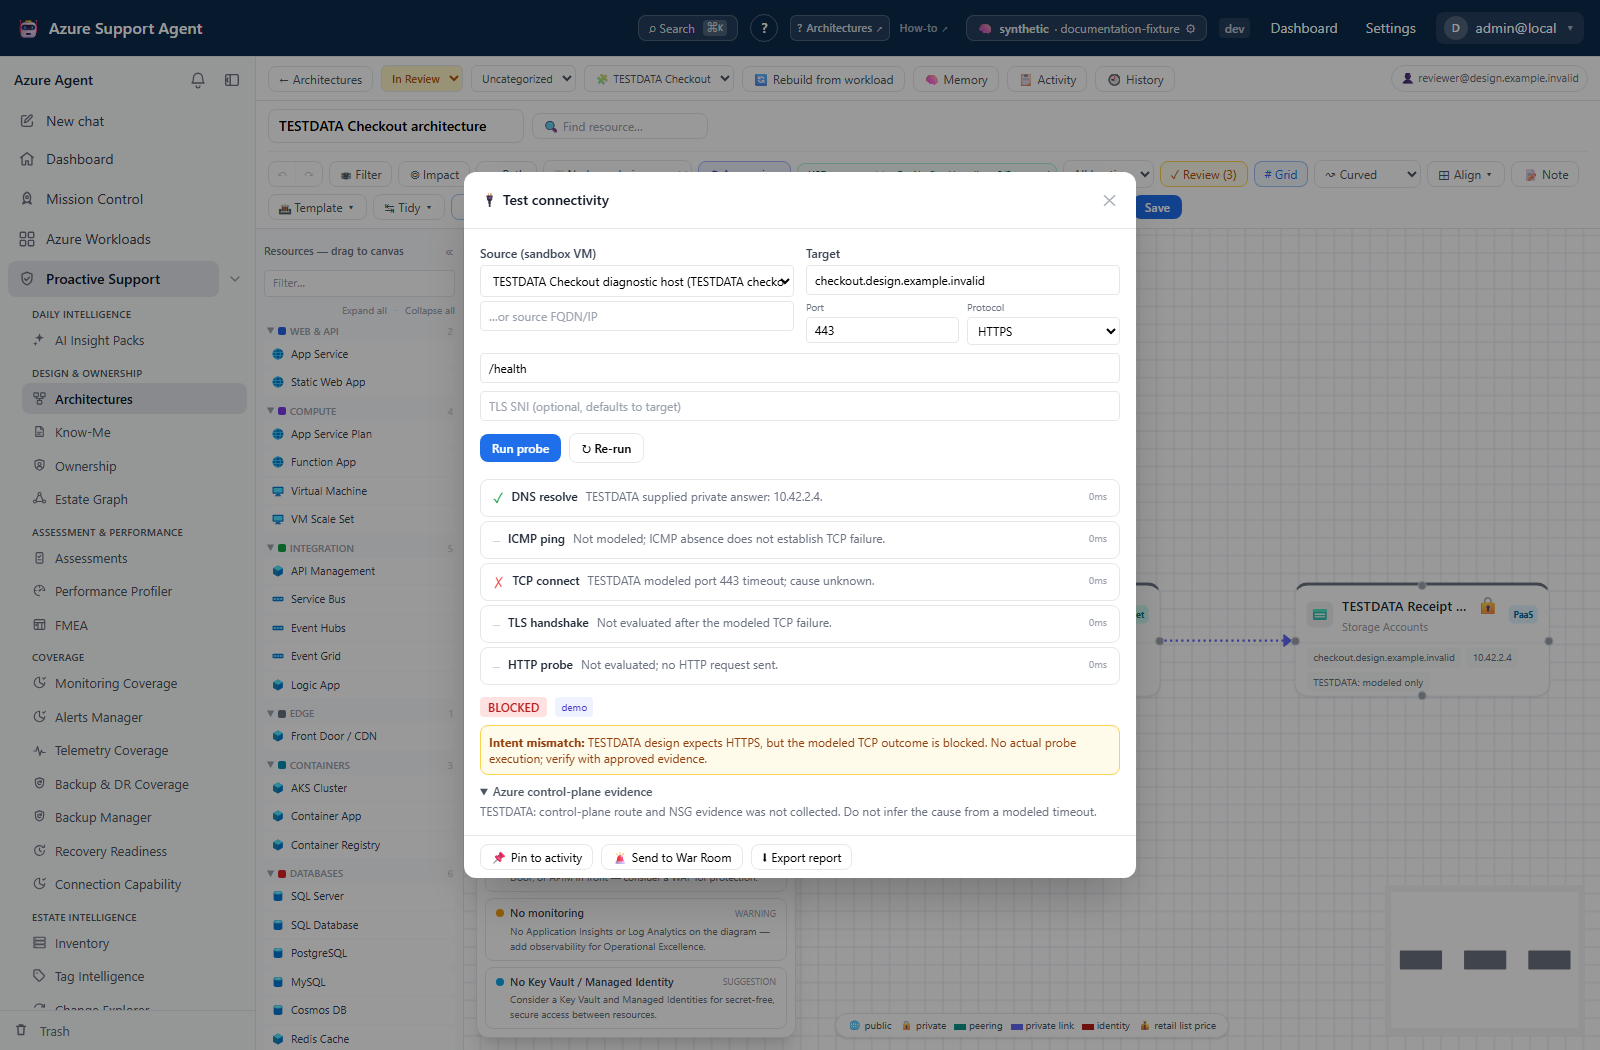
A chain of steps, each recording its command, status, evidence line, raw output, and duration: DNS → ICMP → TCP → TLS → HTTP. Which steps run depends on the protocol.
The verdict summarizes the chain:
| Verdict | Meaning |
|---|---|
reachable | No condition handled by the aggregate verdict marked the run blocked/degraded; inspect every step before accepting it. |
degraded | An HTTP step failed, or any step returned a warning. |
blocked | The TCP step failed, or a DNS or TCP step failed outright. |
ICMP cannot by itself establish a TCP block. An ICMP warning can make the overall result degraded even when TCP succeeds. A failed TLS-only step or administrative gate failure is not fully reflected by the aggregate verdict; a green headline with a failed/skipped required step is not verified reachability. TCP on port 443 also schedules a TLS check. The HTTP scheme is inferred from port 443 or SNI, so verify the actual command for nonstandard HTTPS ports.
The evidence panel
Alongside the probe, the tool can read effective routes and NSG rules when a source NIC ID is available and application-host command execution is enabled. The current sandbox registration form does not collect a NIC ID, so a usable SSH probe can still lack this evidence. The peering field is not populated by this collector.
matched_deny selects an outbound deny candidate by destination port and priority. It does not evaluate the complete packet tuple, allow-rule precedence, service tags, routes, or intervening appliances. Treat it as a rule to investigate, not proof that this specific rule blocked the packet. Connection refusal can also mean no listener rather than an NSG deny.
If those control-plane reads cannot be performed, the panel reports available: false with the reason. The probe result still stands on its own; the evidence is a supplement, never a substitute.
Intent mismatch
If the architecture’s Memory records an expected flow that names this target or port, and the probe comes back blocked, the run is flagged with an expected_reachable_but_blocked mismatch. This is a text match against recorded intent, so it finds contradictions it can see and stays silent about the ones it cannot. Absence of a mismatch is not evidence that the flow is correct.
Debug resolution
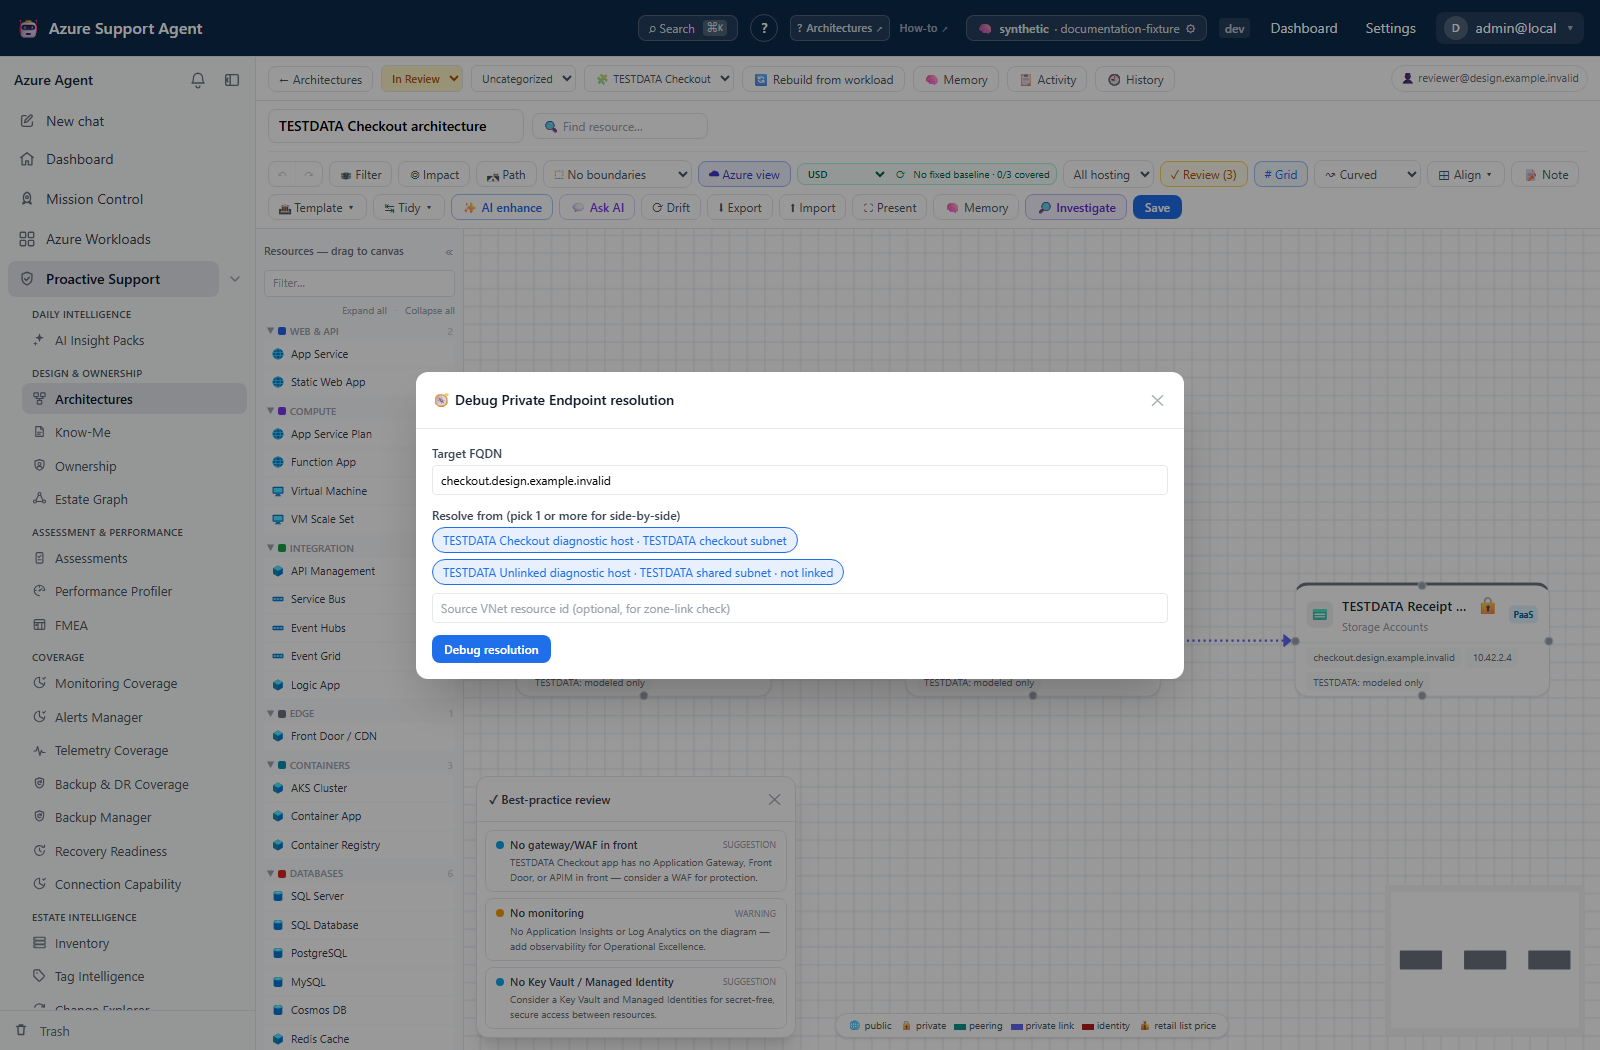
Inputs
Target FQDN, one or more source VMs, and an optional source VNet resource ID. Selecting several sources resolves the same name from each of them side by side, which is how split-horizon and per-VNet resolver problems become visible.
What it runs
Per source: effective DNS configuration, resolution, CNAME/trace evidence, possible hosts-file shadowing, and address classification. Sources run sequentially and their completed steps are streamed in groups. Each returns a resolved IPv4 address and classification of private, public, or nxdomain; the last label also represents no parsed address after tooling/SSH failure, not necessarily a DNS NXDOMAIN response. Review the underlying steps.
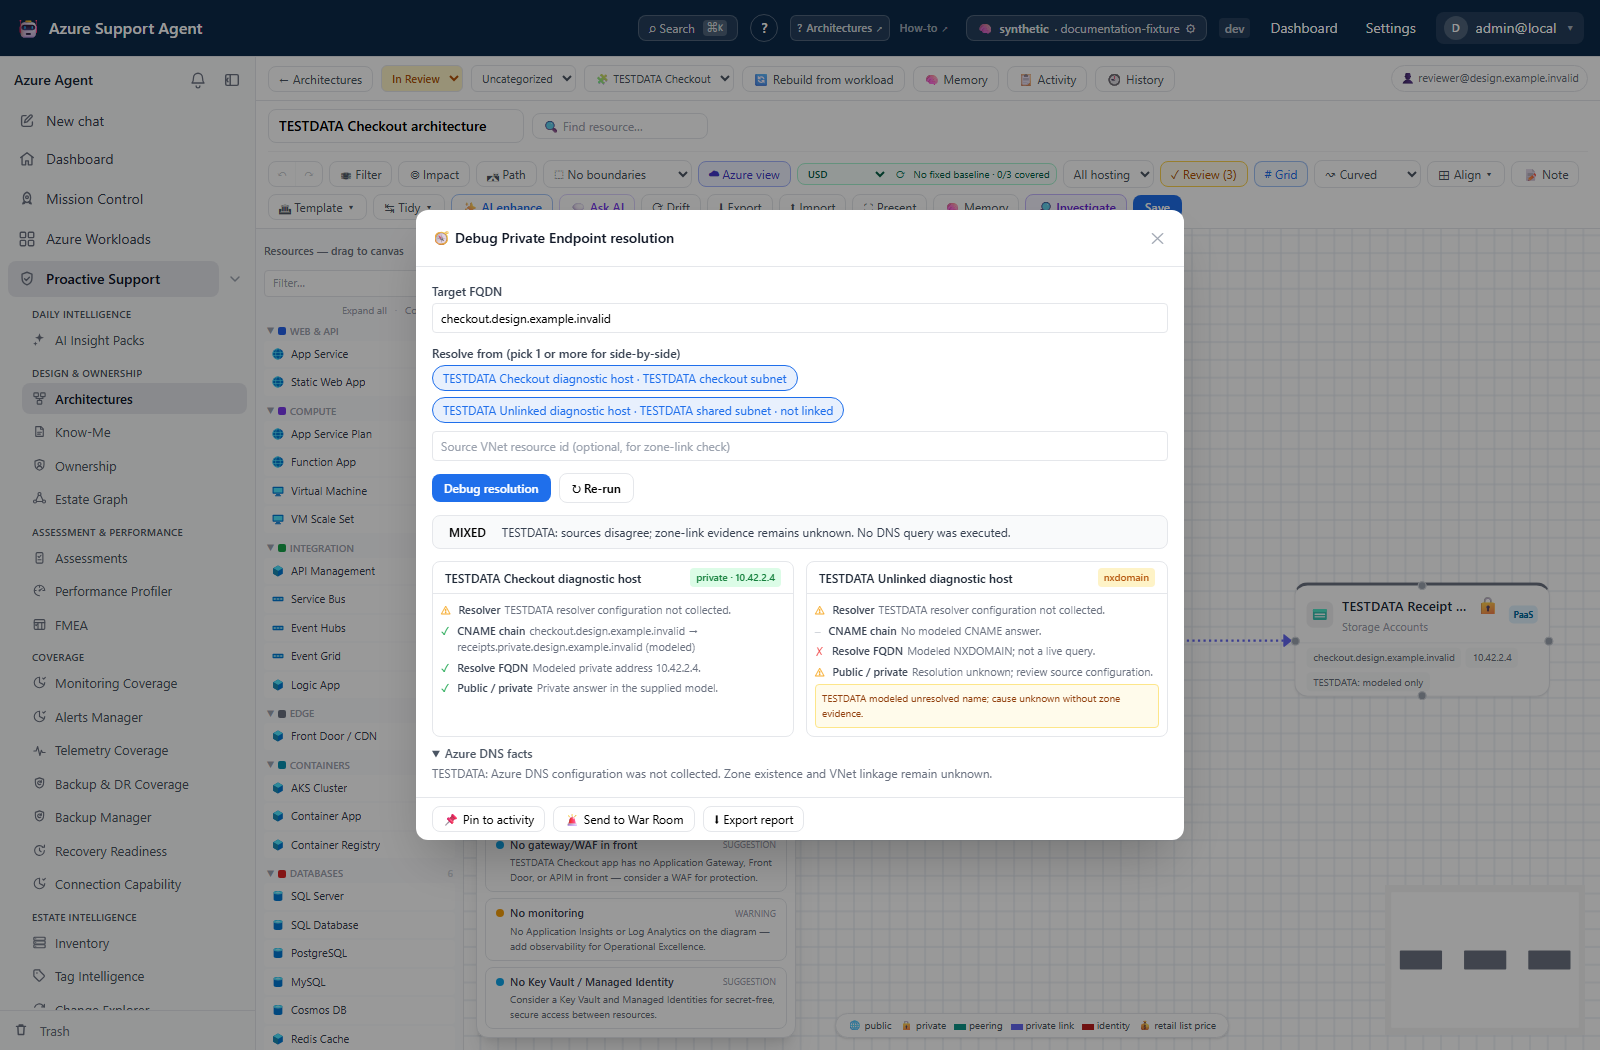
The run then names a root cause:
misconfig_kind | Meaning |
|---|---|
| (empty) | The parsed address is classified private; it has not been matched to the intended private-endpoint NIC. |
missing_zone | The expected privatelink.* zone does not exist. |
missing_link | The zone exists but is not linked to the source VNet. |
custom_dns_override | Public resolution plus detected custom resolvers suggests a forwarding issue; confirm it before changing DNS. |
public_unknown | The name resolved publicly and the private path could not be confirmed. |
no_resolution | The name did not resolve. |
Zone facts
The collector maps 12 supported service suffixes to expected private DNS zones, lists matching zones, and checks links on the first match. With no source VNet ID, any link can satisfy the displayed link flag; supply the exact VNet before relying on it. One zone-fact result is shared across all selected sources, so use separate runs for sources in different VNets when checking links.
The current collector does not populate its A-record IP or VNet custom-DNS fields. Effective resolver observations come from the sandbox, and a private classification is not proof of the intended endpoint or application connectivity. Read the actual record and endpoint NIC through the normal Azure review process. Unsupported suffixes return an unavailable note rather than comprehensive private-DNS coverage.
Generated Bicep
Generate Bicep appears for a non-empty misconfiguration other than no_resolution. It generates text only. The current skeleton declares the zone as existing and adds a VNet link; it does not create a missing zone or repair a custom DNS forwarder. An A record is emitted only when record inputs exist; the normal diagnosis does not populate the endpoint-private-IP input. Complete and validate the proposal through change control before any deployment.
History and comparison
Both tools store their runs and both compare a new run against the previous one for the same subject.
- Connectivity runs are keyed by architecture, source, target, and port. The last 20 runs per key are retained; older ones are pruned automatically.
- DNS retains the last 20 runs per architecture, ordered source-label list, and FQDN key. Changing source order or labels creates another comparison key.
Connectivity diffs compare step status and overall verdict. DNS diffs compare per-source classification only: a changed IP that remains private produces no classification delta. Inspect addresses as well as the diff. Connectivity keys omit protocol/path/SNI and DNS keys omit VNet ID; keep those inputs fixed yourself for a valid before/after comparison.
Preserving a result
| Action | Result |
|---|---|
| Export report | A self-contained Markdown report of the run — path, verdict, per-step results, matched deny rule, and any intent mismatch. |
| Pin to activity | Adds an activity entry referencing the run; it is not an independent immutable evidence copy. |
| Send to War Room | Currently calls the same pin endpoint; the backend does not use the to_war_room flag to create or navigate to an investigation. Open Chat separately for a handoff. |
Both tools also offer a demo seed that generates a healthy and an unhealthy run so the workflow can be reviewed without a live sandbox VM. Seeded runs are marked demo and must not be read as findings about the estate.
Limits and safety
These tools do not deploy Azure changes, but probes and optional package installation have operational effects. The endpoints are gated by netdiag.run; they invoke the shared SSH runner without an additional sandbox.exec permission check. Do not assume the two permissions must both be present for a diagnostic run.
- A probe proves one path at one moment. A
reachableverdict describes the source, target, port and time it was run with, and generalises to nothing else. - The source is the sandbox VM, not the application. Results describe what that VM can reach. A different subnet gets different answers.
- Per-step timeouts are short — roughly 2 seconds for DNS and ICMP, 5 for TCP, 8 for TLS and HTTP. A slow-but-working path can appear as a failure. Confirm before acting on a single timeout.
- Raw output is truncated to the first 4,000 characters per step.
- The evidence panel can be unavailable without the probe being wrong, and the probe can be right while the evidence is stale.
- Commands run under the sandbox account. Strict-mode classification is heuristic and host-key comparison depends on a prior trusted fingerprint. Preinstall required tools and follow Sandbox VM diagnostics for host/credential boundaries.
- Diagnostic runs are retained in their own stores; the shared SSH runner does not itself create a VM-console run-history entry for each probe step.
Troubleshooting
| Symptom | Resolution |
|---|---|
| “No sandbox VM is onboarded for this architecture’s workload” | Register a VM under /admin/sandboxvms and associate it with the workload, or select a VM explicitly in the picker. |
| A source was entered but probes will not run | A typed source only labels the run. Live probing needs an SSH-reachable sandbox VM selected as well. |
| “Sandbox VM tools are disabled by the administrator” | The administrative kill switch is off. This is deliberate; do not work around it. |
| The picker warns that no VM is linked to the workload | All sandbox VMs are being offered instead. Confirm the one you pick actually sits in the relevant network before believing the result. |
| A step reports that a command needs approval | The VM is in strict mode and the required tool is absent. Install it through the VM’s normal maintenance process. |
Evidence panel shows available: false | Control-plane reads were not possible. Check the Azure connection’s networking read access and whether command execution is enabled. |
| ICMP fails but TCP succeeds | Expected on most Azure networks. Read the TCP result. |
| Green connectivity headline but TLS or Gate failed | The aggregate verdict does not cover every step failure. Treat the required layer as unverified; resolve the failed gate/TLS step rather than trusting the headline. |
| DNS resolves publicly when a private endpoint exists | Read misconfig_kind. missing_zone, missing_link, and custom_dns_override each require a different fix. |
| Two sources disagree | Compare their effective DNS servers and endpoint addresses. If their VNets differ, rerun each with its own VNet ID rather than relying on shared zone facts. |