Visual tour
Follow a critical operational question from workload scope to findings, evidence, and a reviewed next step. The collection contains 270 captured UI states, with relevant application screenshots on all 204 public documentation pages, including section indexes and auxiliary pages. This tour offers representative highlights and grouped routes into the detailed reference and how-to views rather than loading the entire collection on one page. Select any screenshot to inspect it full-size. The screenshot manifest records the exact collection, route and synthetic-source notes.
Read the examples safely
- Synthetic, not live: the screenshots use an isolated documentation instance with seeded demo records, synthetic browser responses, or built-in catalogs and defaults. Names, identifiers, measurements, costs, and conclusions do not describe a customer tenant. A populated result is not proof that a live Azure or Microsoft Graph collection, assessment, or AI investigation ran.
- Presentation is not evidence: scores, completion labels, framework mappings, and investigation conclusions illustrate how to read the UI. They are not certification, proof of root cause, or a test of backend persistence. Evidence Locker hashes and verified badges in the fixtures do not demonstrate a cryptographic integrity check.
- Default settings and unsaved forms are different states: configuration pages may show shipped defaults or explicitly unsaved drafts. Connection, provider, network, and instruction drafts were not saved, validated, or applied; credential fields are intentionally empty. Do not copy example values into a production connection or infer that a displayed provider works.
- A preview is not an executed action: a tool directory or built-in agent definition does not prove a workflow ran. Case drafts, remediation previews, and backup selection screens do not demonstrate case creation, access removal, export, or restore. The illustrated disabled-access removal and rollback previews contain comments, not executable remediation.
- Verify your own scope: before acting, check the selected connection and workload, permissions, source freshness, errors, and missing data in the owning feature. Unknown, not assessed, and unavailable are not healthy results. Review proposed changes, approvals, and rollback separately.
Establish scope and understand the estate
1. Triage readiness and choose the next investigation
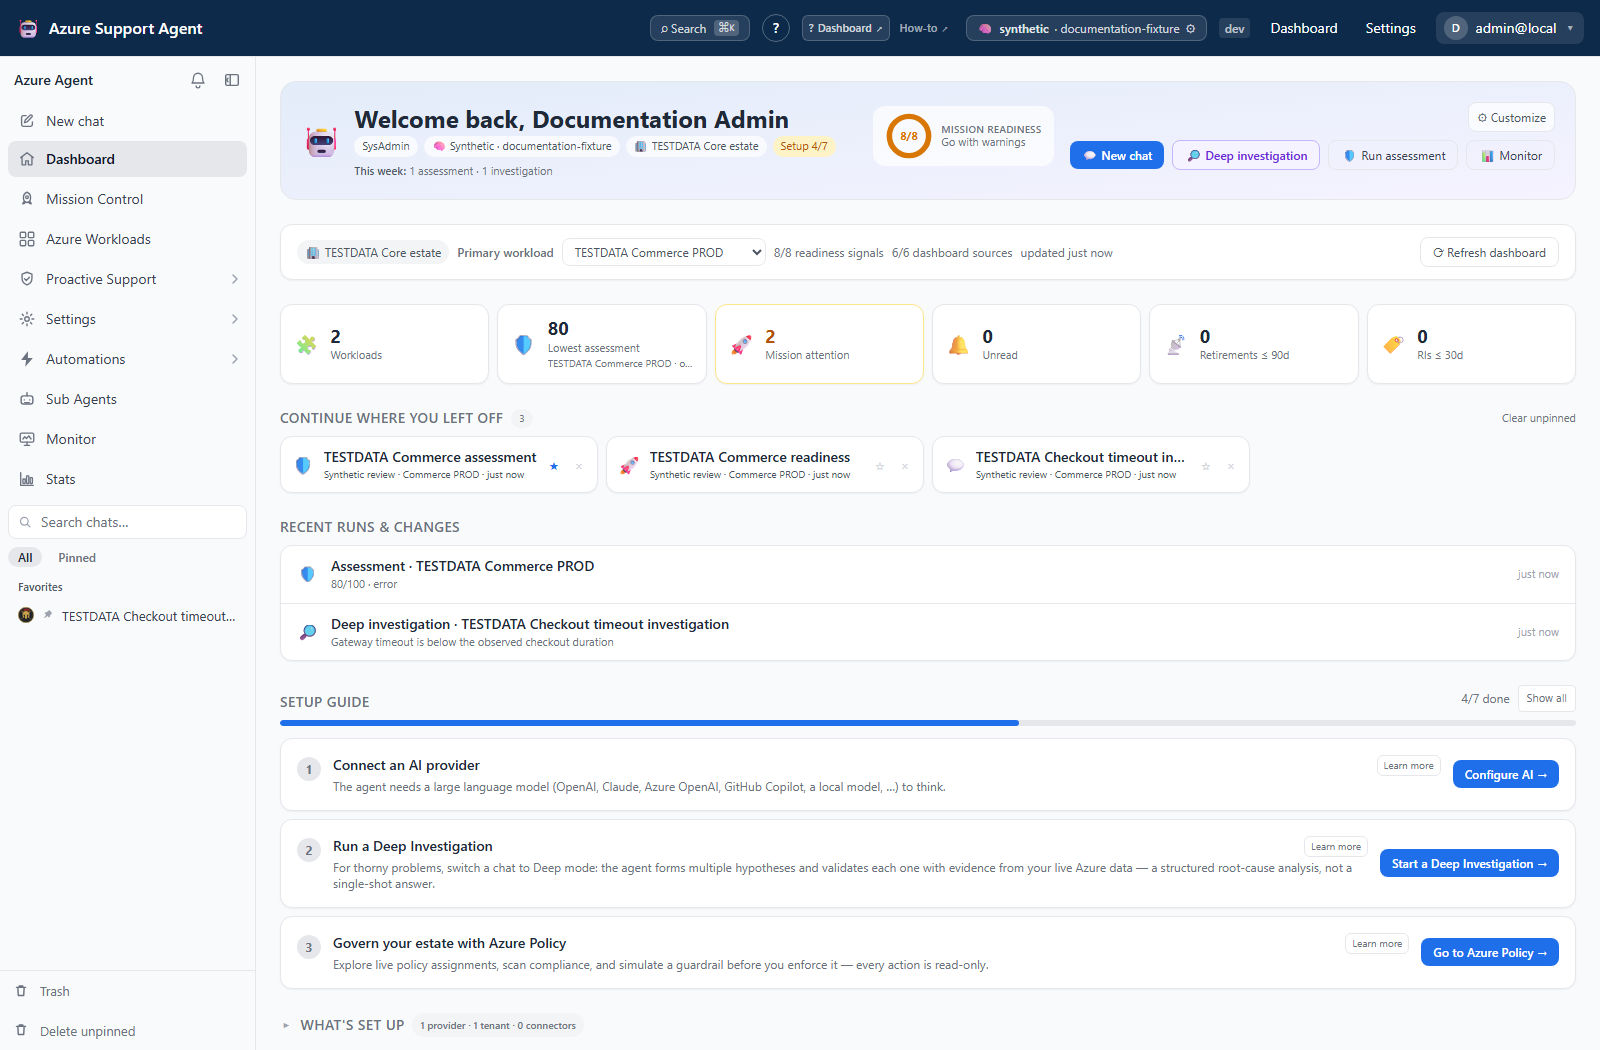
Start with Dashboard for the primary workload and saved activity. Use Mission Control to move from fleet readiness to a workload board, attention tiles, and saved history. Follow the Dashboard and Chat workflow or Mission Control recipes when ready to work in your own scope.
2. Confirm workload membership and compare environments
Move from the Workload Fleet to Workload Detail to inspect the actual member resources. Groups and Overlaps covers group membership and production-versus-development comparison; the workload and group recipes explain the review sequence.
3. Inspect architecture and relationship context
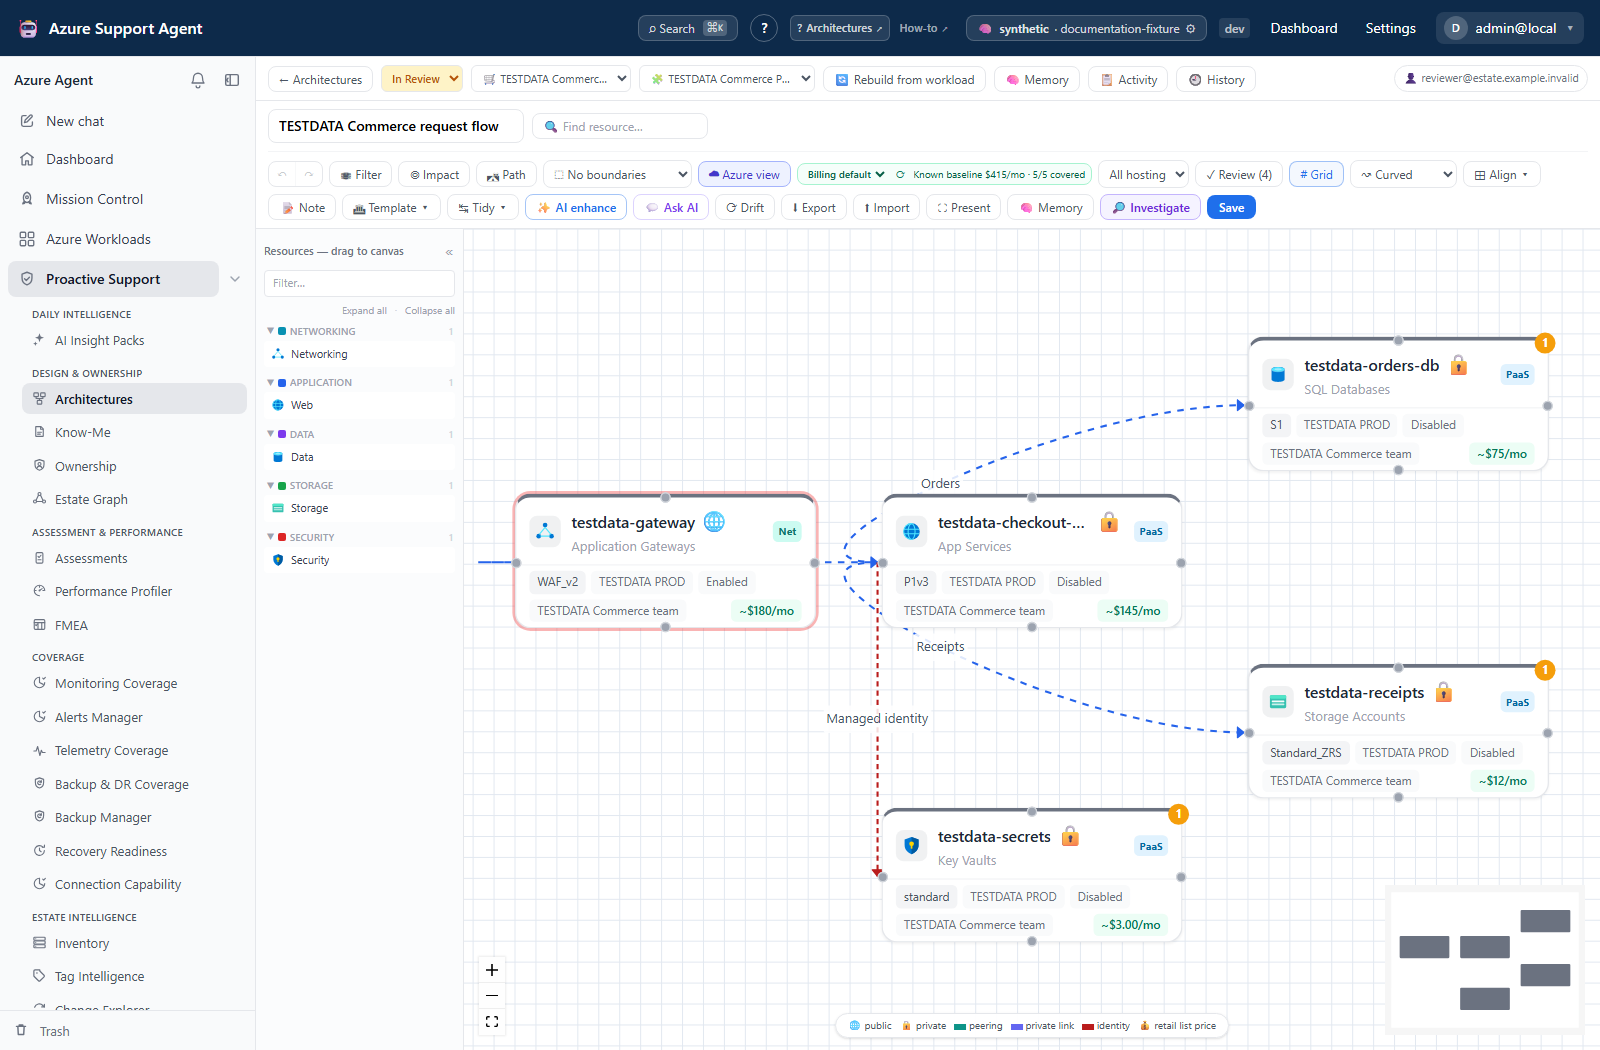
Architectures covers the gallery, connected canvas, resource inspector, and retained versions. Use Estate Graph and its exploration recipes to navigate typed relationships across workloads, architectures, and resources. A modeled edge does not establish live traffic or causality.
4. Explain inventory, cost, tags, and accountability
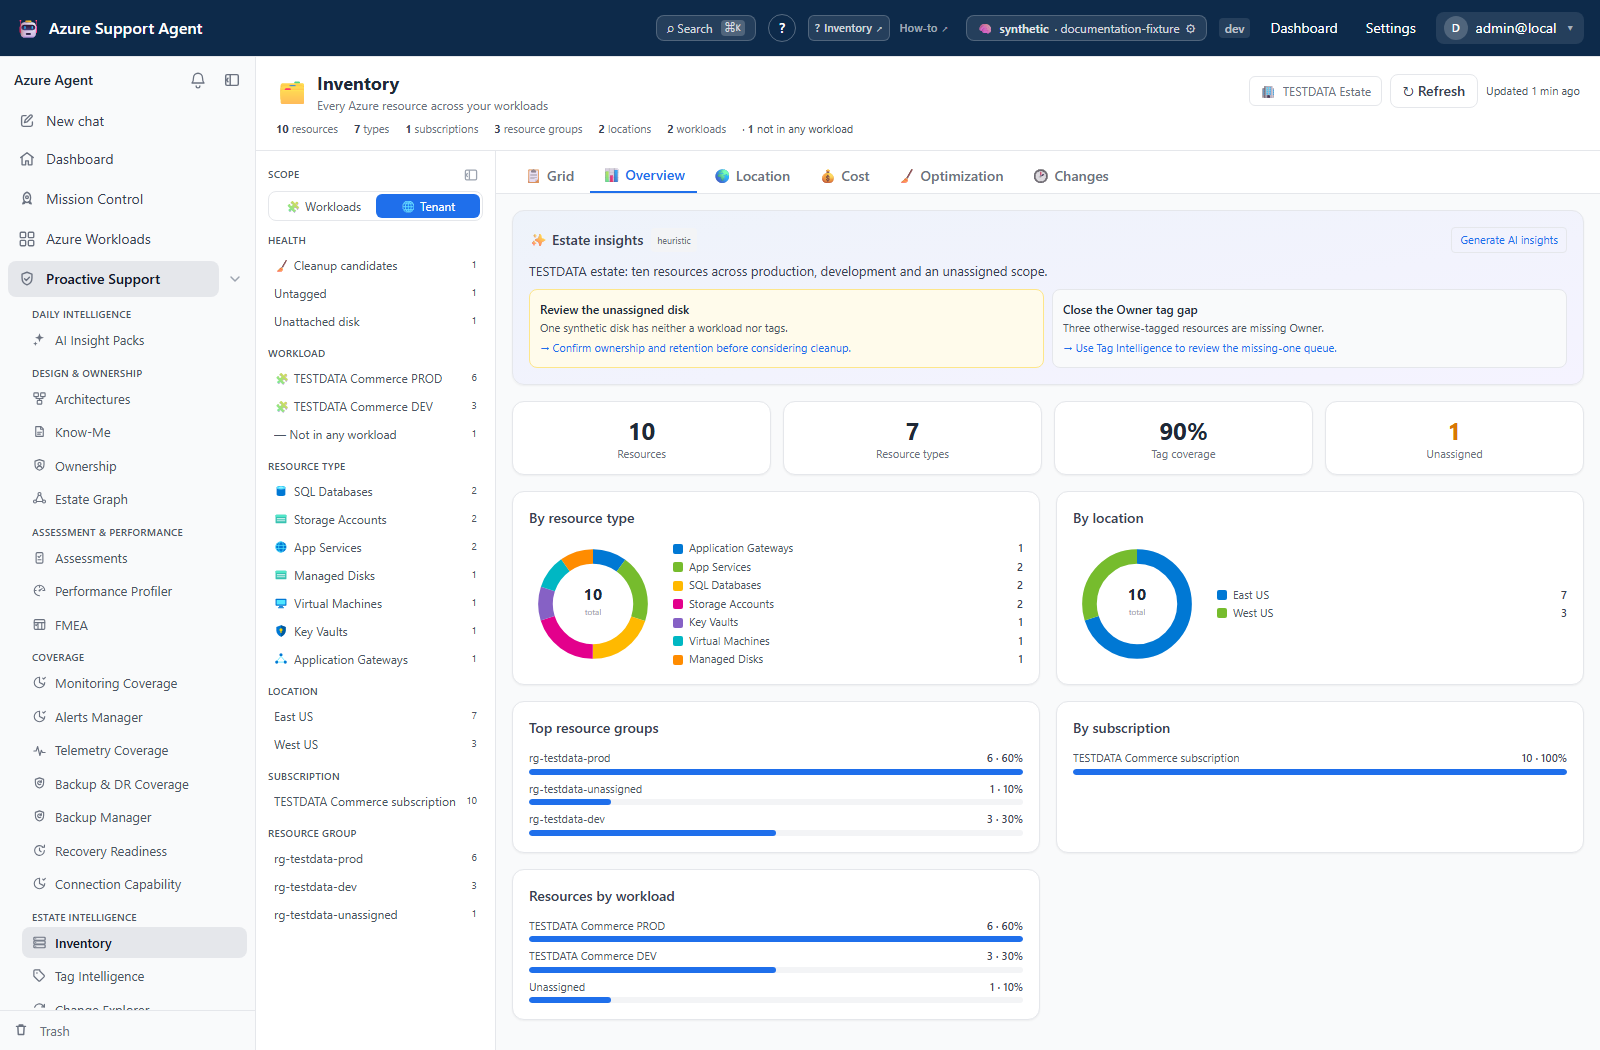
Use Inventory for estate composition, cost views, location grouping, and resource drawers. Continue into Tag Intelligence for census, normalization, key/value drill-down, and required-tag gaps, then Ownership for accountable teams, assignment sources, and coverage.
Prioritize findings and retain the investigation
5. Review assessment findings and performance constraints
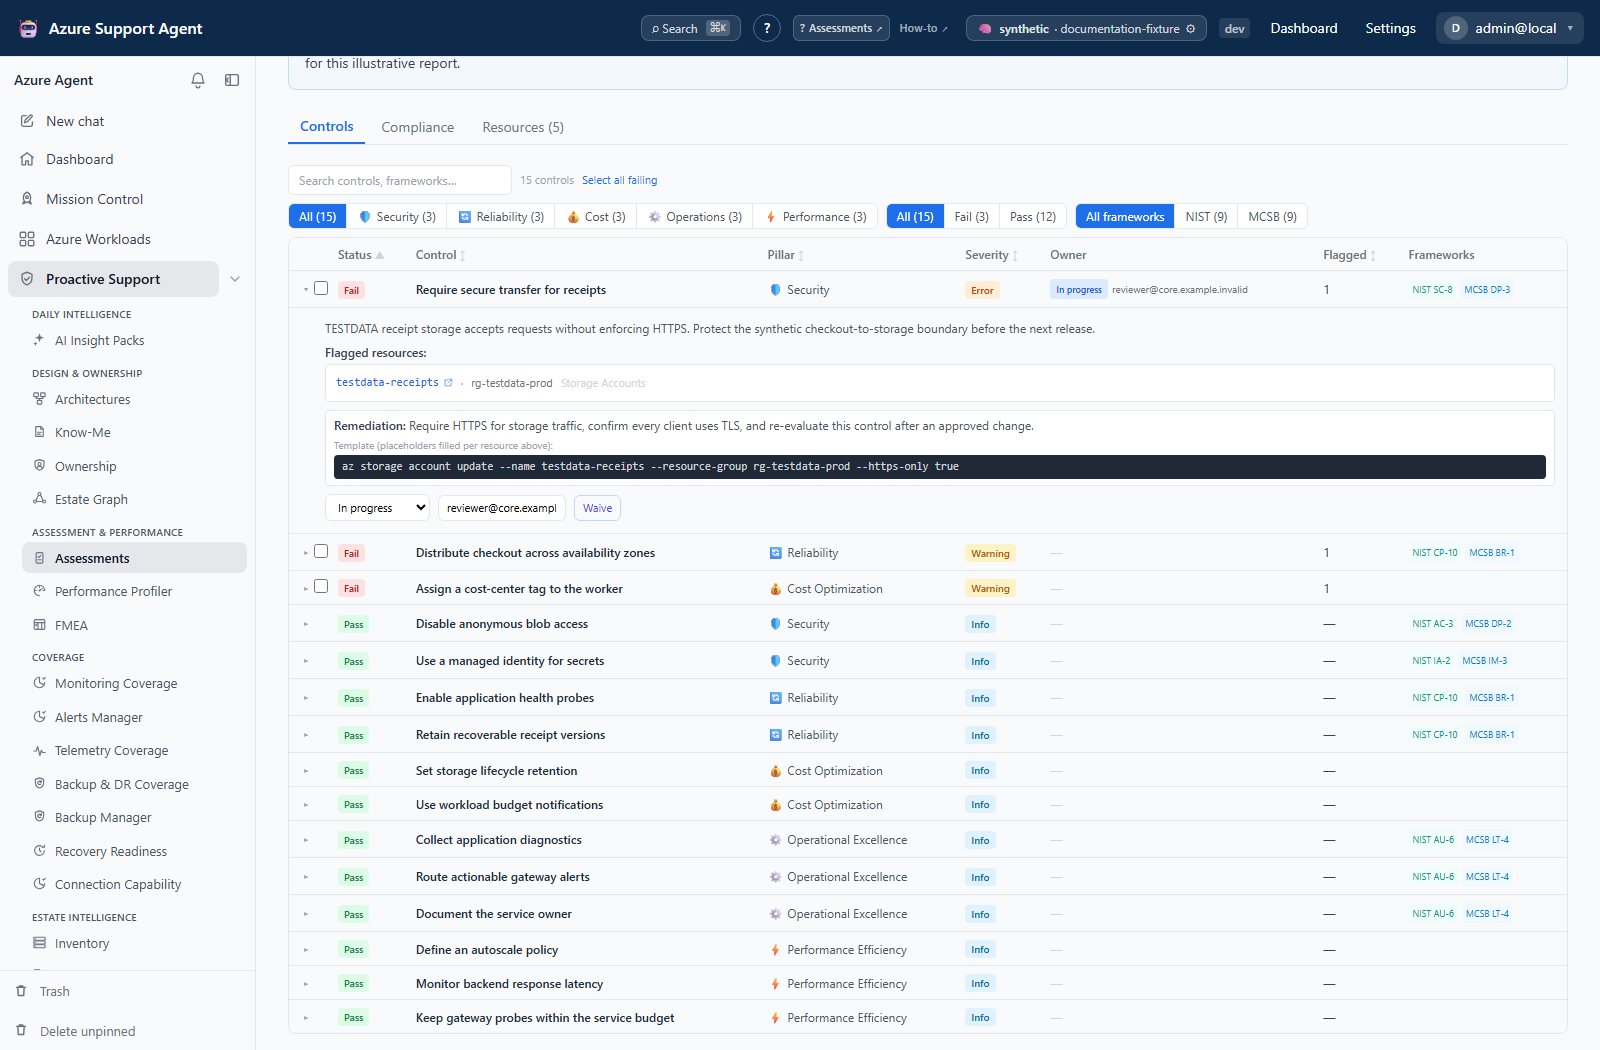
Assessments connects pillar scores to expanded findings and compliance mappings. Follow assessment governance recipes to review completeness, ownership, and follow-up. Performance Profiler adds resource metrics, inventory, heatmaps, and bottleneck views; neither a score nor an AI summary replaces the underlying observations.
6. Investigate a symptom, correlate changes, and preserve context
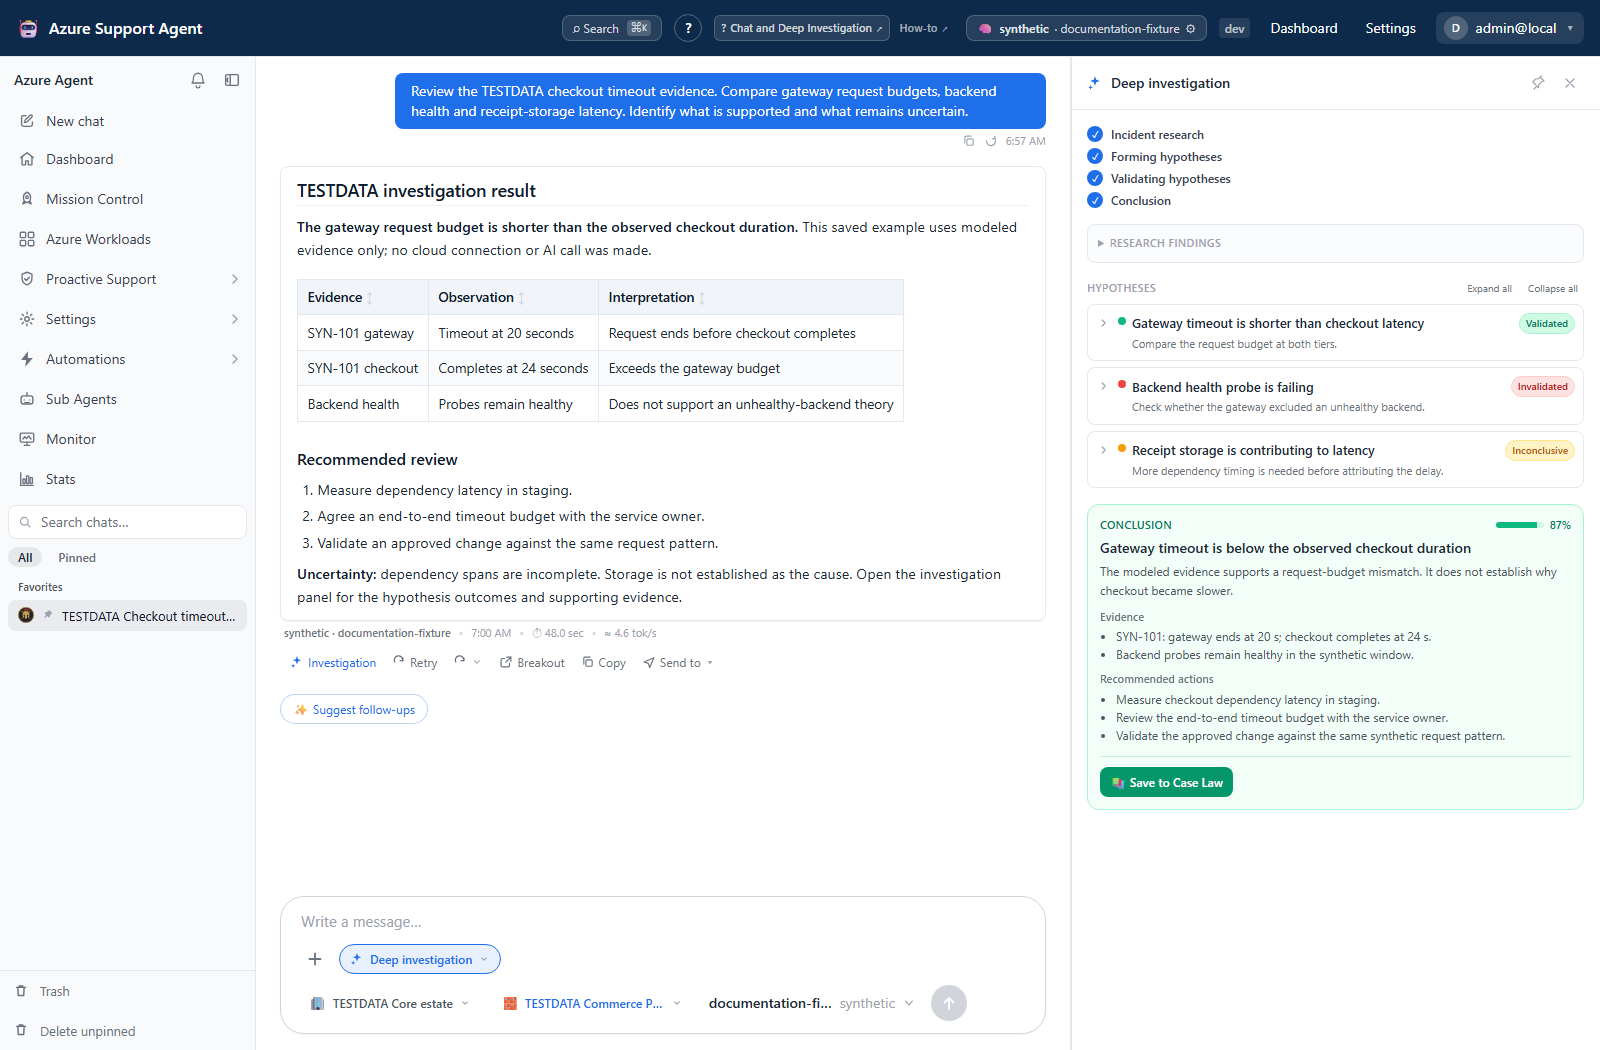
Use Chat and Deep Investigation to review a question, competing hypotheses, evidence, and proposed actions. Correlate the result with Change Explorer summaries, event details, and technical diffs. Evidence Locker provides snapshot content and comparisons; Case Files connects the case queue, draft, and incident timeline. Verify real source records before preserving or sharing a conclusion.
Check operational coverage and recovery
7. Find missing monitoring and diagnostic signals
Monitoring Coverage shows the baseline matrix, all-resource view, and alert evidence. Telemetry Coverage adds diagnostic categories and resource-level settings. Use the monitoring and telemetry recipes to separate missing configuration from unsupported or unreadable evidence.
8. Review alert noise and notification routing
Alerts Manager covers rationalization, individual rule analysis, action-group destinations, routing gaps, and overlapping notifications. The operations guide explains how to inspect a proposed change before applying it; a displayed destination does not prove delivery.
9. Trace backup protection from coverage to operations
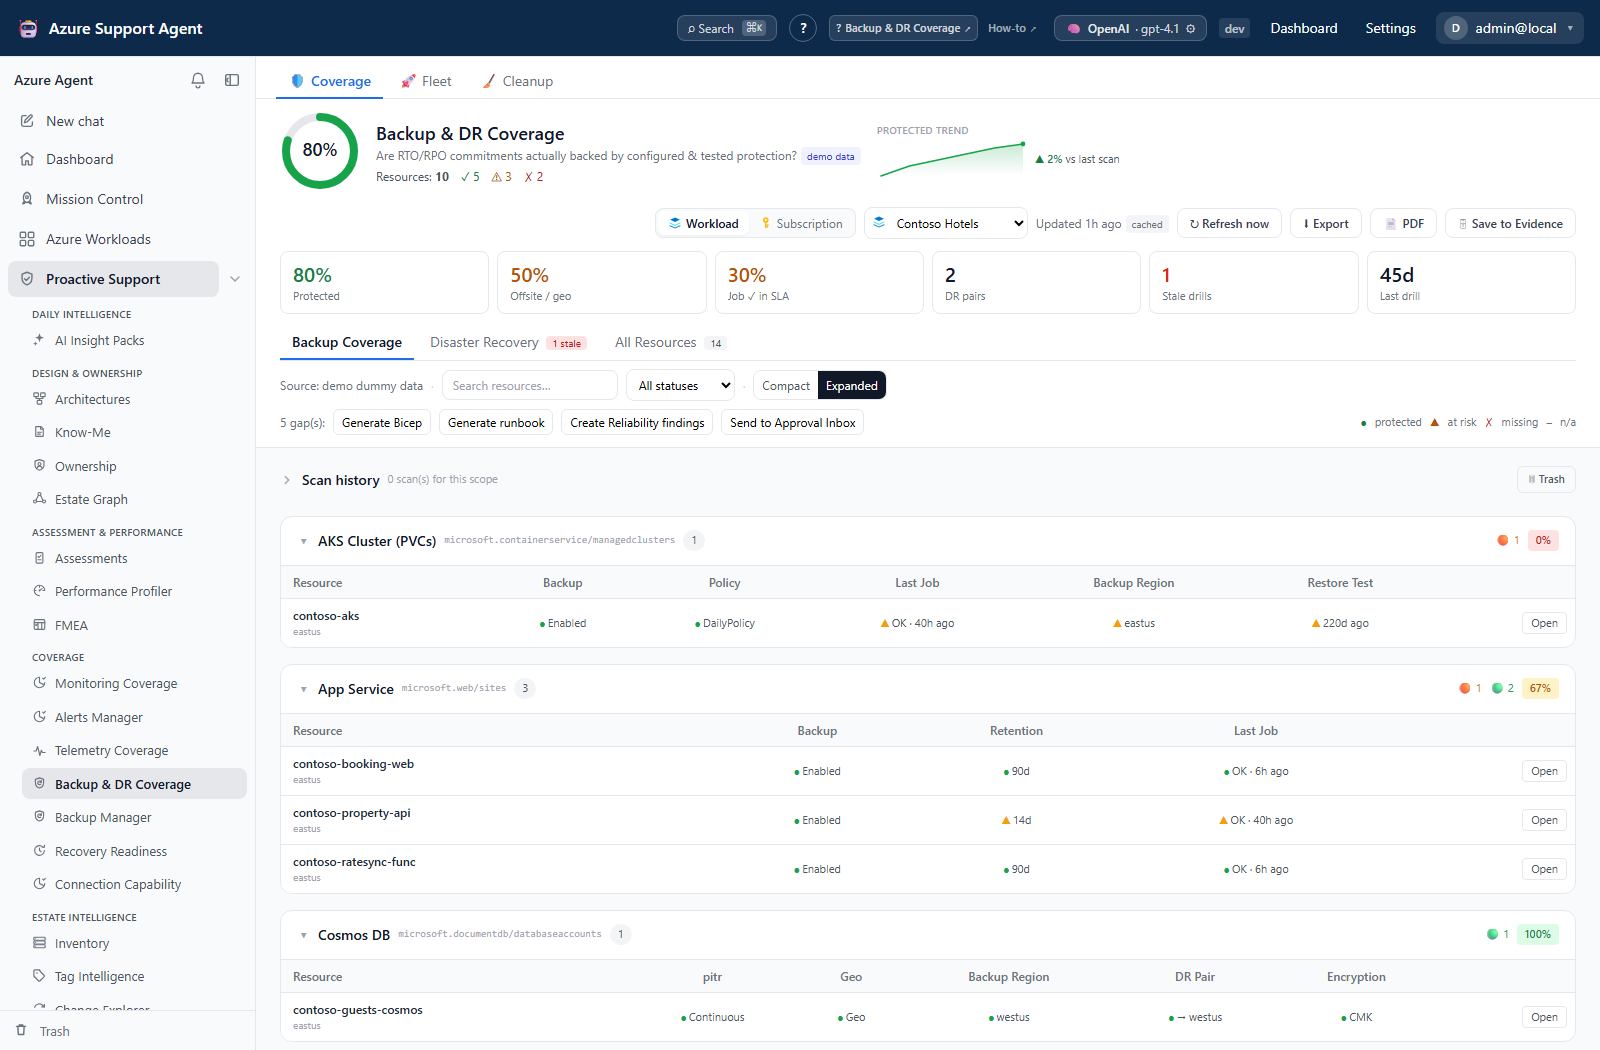
Start with Backup & DR Coverage for protection checks and resource-state detail. Backup Manager adds protected items, policies, failed-job remediation, vault controls, protection flows, cost and waste, and Site Recovery. The coverage recipes and manager recipes keep gap review separate from operational changes.
10. Test the reasoning behind recovery readiness
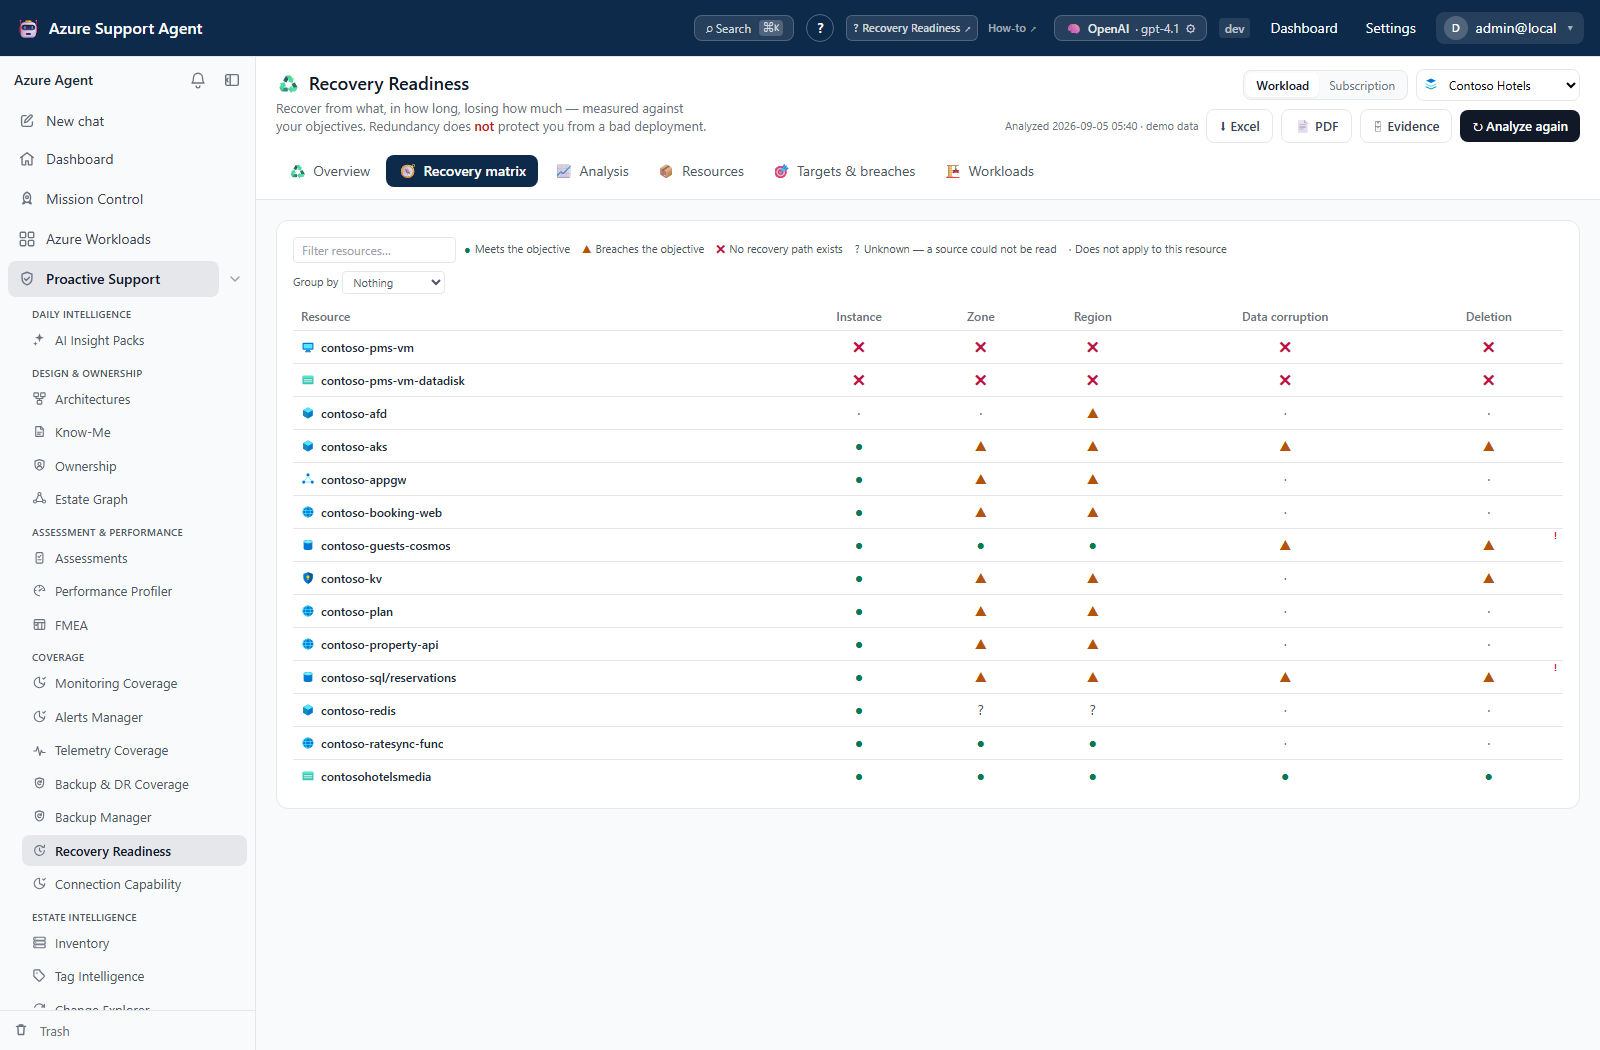
Recovery Readiness connects the overview and scenario matrix to the resource register, per-resource reasoning, workload weakest link, objective breaches, and analysis detail. Follow the recovery review workflow to distinguish an unknown outcome from a known lack of a recovery path.
11. Anticipate capacity limits and service retirements
Quota Monitor links capacity posture to individual limits. Retirement Radar connects deadlines to migration-impact detail. Use the quota and retirement recipes to verify scope, source dates, and the proposed next step before planning a change.
Review identity and access exposure
12. Follow grant paths and review disabled-account exposure
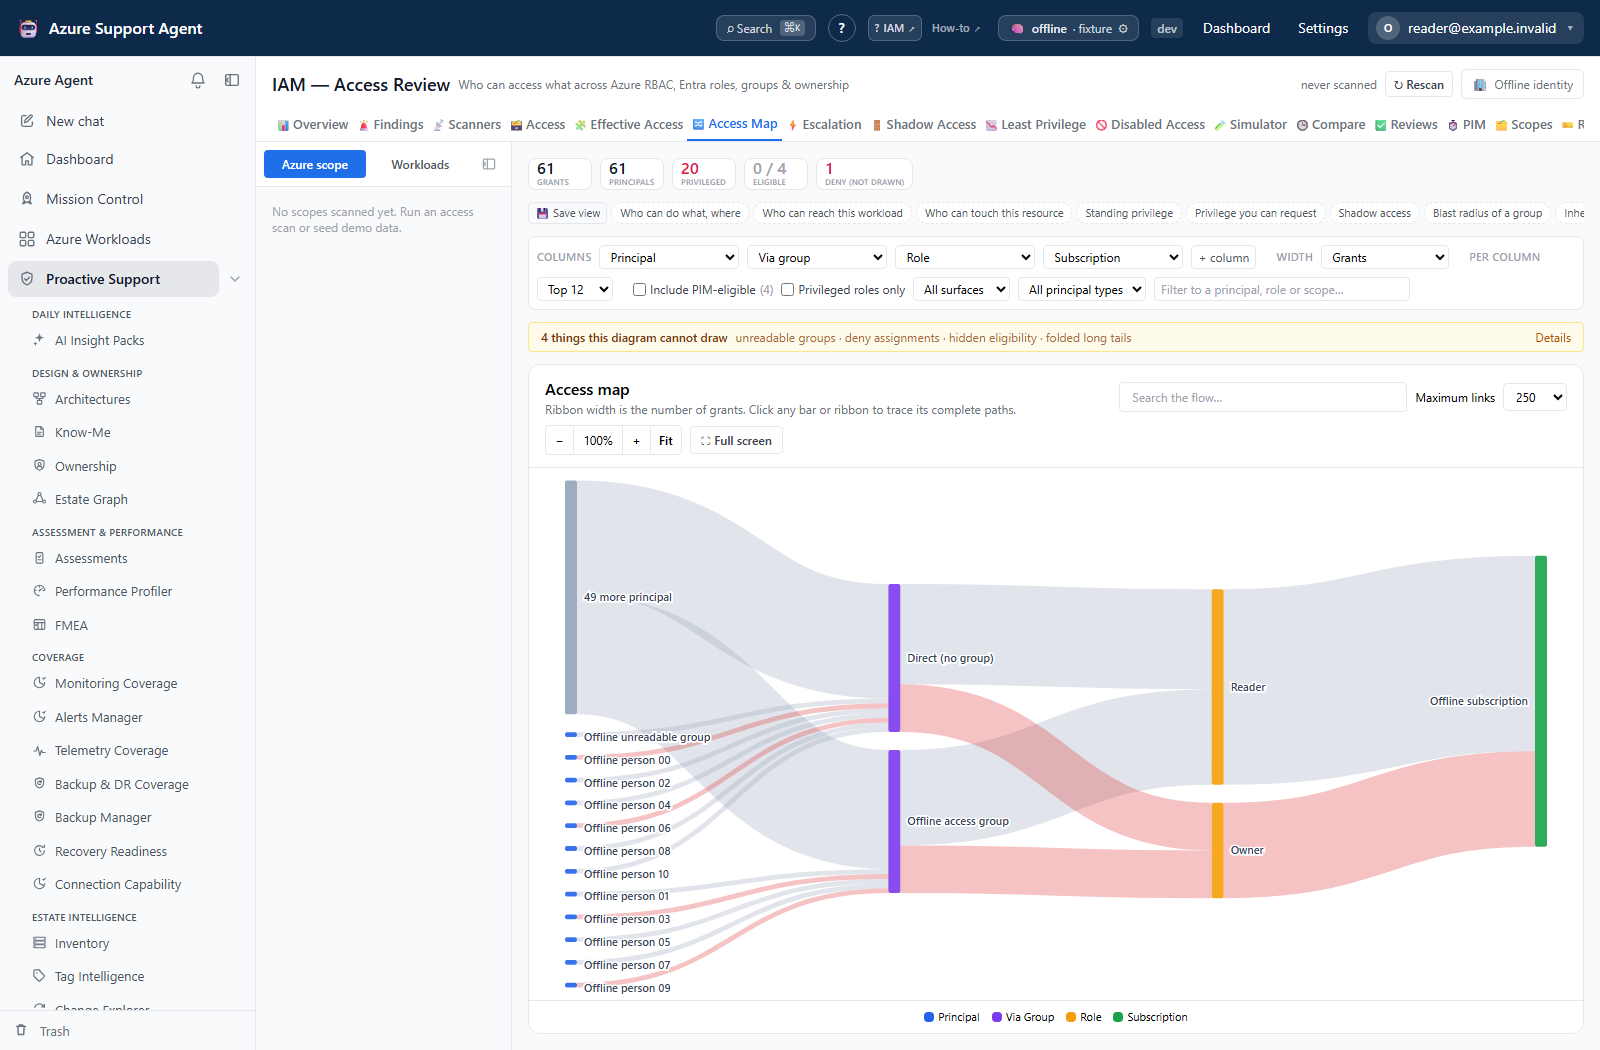
IAM covers the grant grid, Access Map, standing versus eligible privilege, grant paths, and groups whose membership could not be expanded. Use the disabled-access workflow to review direct grants, group-derived access, owned applications, recoverable identities, and separate removal/rollback previews. Missing membership is a coverage limit, not proof that a group grants no access.
13. Investigate principals and scanner findings
Entra principal investigation includes search, Azure access, cached and transitive memberships, group members, cycle handling, and change history. Findings and scanners explains saved baselines and deltas; the investigation recipe connects them. Zero new findings does not mean there are no existing findings.
14. Examine authentication, Conditional Access, and blast radius
Use Entra setup and coverage for authentication perimeter and federation trust context. Conditional Access covers user/application coverage, exposure, and impact; Blast Radius adds privileged, escalation, federation, and primitive-specific paths. Follow the coverage-gap workflow without treating unavailable controls as protected.
15. Review guests, privileged activity, and PIM hygiene
Guest access separates lifecycle states, partner organizations, and pending invitations. Privileged access connects activation sessions and actions with stale eligibility and standing-access drift. The guest review and privileged-activity review guides explain how to interpret unknown activity and elevation context before taking action.
Configure a controlled operating environment
16. Complete onboarding and select connection methods
Use First-Run Setup and Overview and Prerequisites to choose the right tool; the Proactive Support screenshot is a directory, not an operational dashboard. Azure Tenants covers host identity, pasted tokens, service-principal secrets, and certificates. AI Providers includes Azure OpenAI and OpenAI configuration examples. These draft forms do not establish that credentials were supplied or a connection was tested.
17. Separate application roles, sign-in policy, and network restrictions
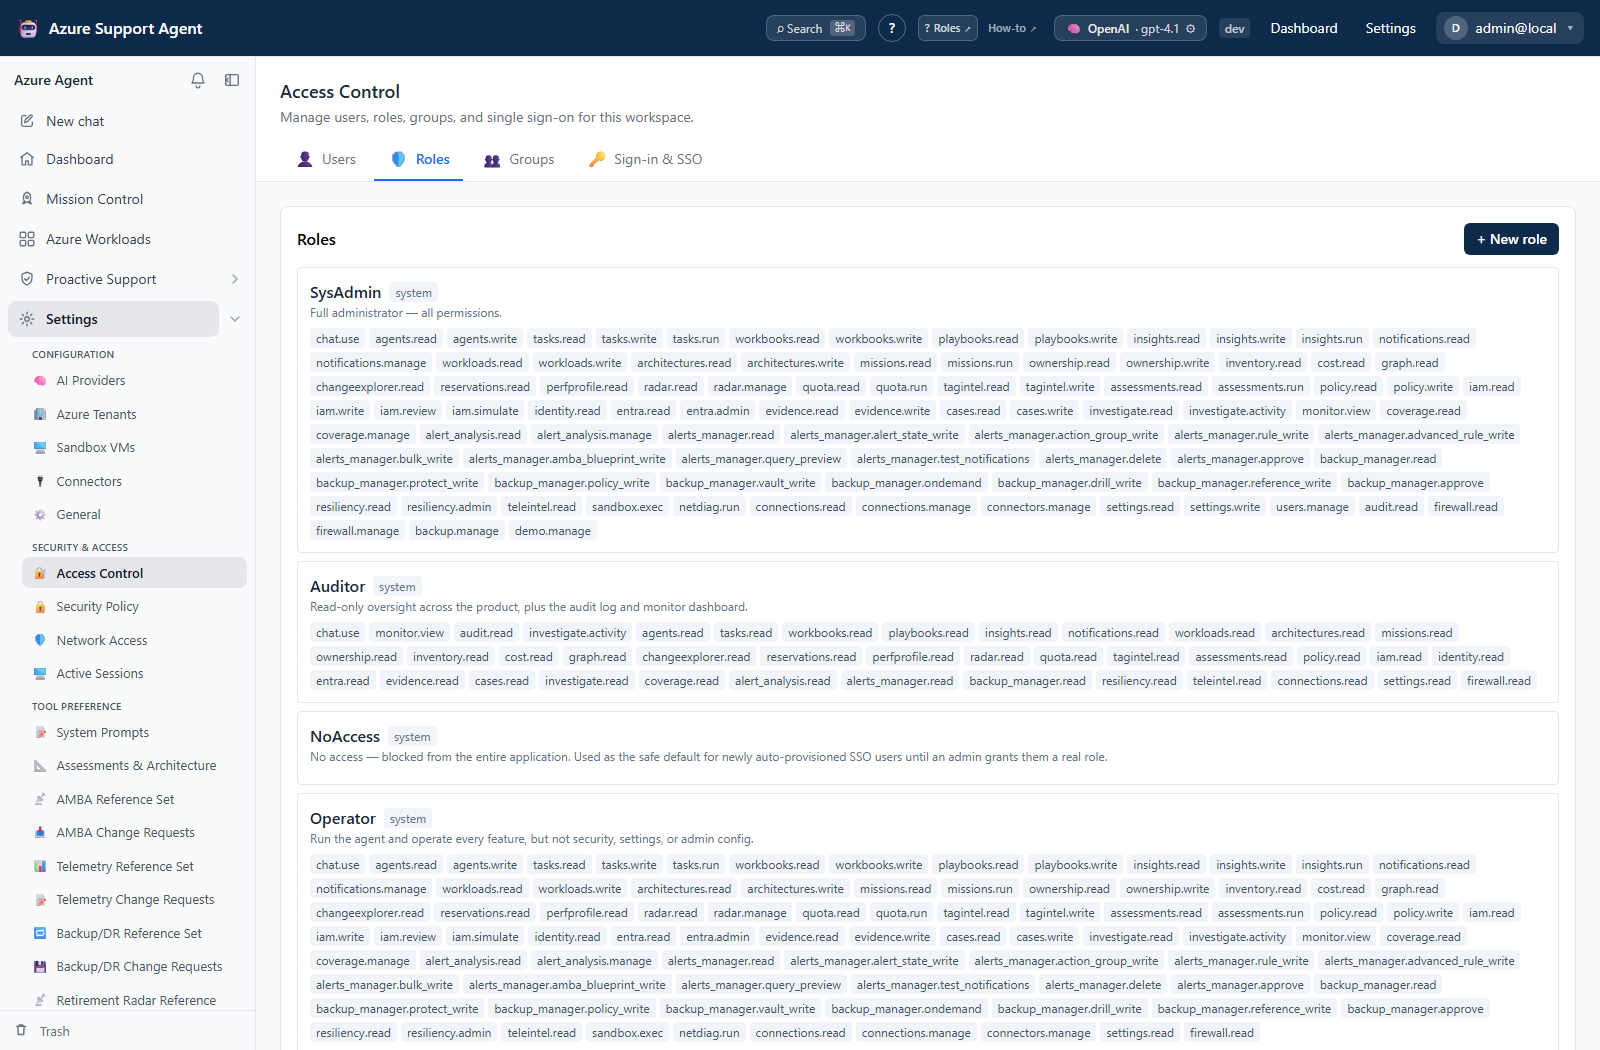
Access Control shows local users and built-in roles; Permissions explains the exact product capabilities. Security Policy & Active Sessions and Network Access cover different control layers. Review the defaults and preserve recovery access before making changes; the network example is an unsaved draft, not an applied firewall rule.
18. Inspect instructions, scoring, and reference baselines
General Settings shows an unsaved instruction draft. System Prompts & Assessments covers the built-in Chat Agent prompt, assessment defaults, and workload-health weights. Reference Sets & Change Requests shows AMBA VM baselines, backup/DR checks, and Key Vault telemetry categories. Distinguish inspecting shipped definitions from saving a customization or running its checks.
19. Understand agents and automation before enabling execution
Sub Agents and the agent-management workflow describe the built-in library. The Automations and connectors directory leads to Scheduled Tasks, Workbooks, Playbooks, and Notifications. The directory and defaults are not evidence of agent invocation, scheduled execution, or notification delivery.
20. Review application backup scope and demo-data boundaries
Backup & Restore and Demo Data covers the application export-section catalog and the loaded synthetic workload scope; it is separate from Azure resource backup protection. Follow the backup and demo-data workflow before exporting, restoring, or removing data. The captured screens do not demonstrate a download, upload, restore, or deletion.
Explore additional illustrated workflows
Design, discovery, and diagnostics
- Know-Me: review ownership context, knowledge, and memory before interpreting an answer.
- FMEA and AI Insight Packs: inspect draft scenarios, ranked concerns, evidence, and run history.
- Discovery Autopilot and Connection Capability: distinguish discovery proposals and unknown capabilities from confirmed collection.
- DNS resolution, connectivity, and sandbox diagnostics: inspect inputs and illustrative results without implying that a network probe ran during capture.
Policy and identity decisions
- Azure Policy: navigate definitions, assignments, effective policy, advisors, history, drift, and rollout planning.
- Entra applications, signals, and governance: compare permissions, activity, and review coverage.
- IAM comparisons, escalation review, and scanner inbox: follow synthetic changes and findings through the review process.
Automation, integrations, and administration
- Workbooks, playbooks, scheduled tasks, and notifications: compare unsaved configuration with synthetic history; no query, schedule, or delivery was executed for these examples.
- Connector lifecycle and the connector reference: review native configuration modes with intentionally empty credential fields.
- Administration and security: inspect audit history, durable work, tool permissions, sandbox settings, sessions, and approval boundaries.
- Keyboard shortcuts and the glossary: locate the in-app help views while following a task.
Continue with a task
Choose the relevant how-to guide for prerequisites, steps, expected results, and verification. Use the full feature reference for behavior and limitations, or the troubleshooting index when your own instance differs from an example.